
 French
 Deutsch
Metabarcoding
| Part of a series on |
| DNA barcoding |
|---|
 |
| By taxa |
| Other |
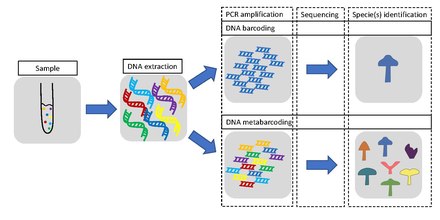
Metabarcoding is the barcoding of DNA/RNA (or eDNA/eRNA) in a manner that allows for the simultaneous identification of many taxa within the same sample. The main difference between barcoding and metabarcoding is that metabarcoding does not focus on one specific organism, but instead aims to determine species composition within a sample.
A barcode consists of a short variable gene region (for example, see different markers/barcodes) which is useful for taxonomic assignment flanked by highly conserved gene regions which can be used for primer design.[1] This idea of general barcoding originated in 2003 from researchers at the University of Guelph.[2]
The metabarcoding procedure, like general barcoding, proceeds in order through stages of DNA extraction, PCR amplification, sequencing and data analysis. Different genes are used depending if the aim is to barcode single species or metabarcoding several species. In the latter case, a more universal gene is used. Metabarcoding does not use single species DNA/RNA as a starting point, but DNA/RNA from several different organisms derived from one environmental or bulk sample.
Environmental DNA[edit]
Environmental DNA or eDNA describes the genetic material present in environmental samples such as sediment, water, and air, including whole cells, extracellular DNA and potentially whole organisms.[3][4] eDNA can be captured from environmental samples and preserved, extracted, amplified, sequenced, and categorized based on its sequence.[5] From this information, detection and classification of species is possible. eDNA may come from skin, mucous, saliva, sperm, secretions, eggs, feces, urine, blood, roots, leaves, fruit, pollen, and rotting bodies of larger organisms, while microorganisms may be obtained in their entirety.[6][7][4] eDNA production is dependent on biomass, age and feeding activity of the organism as well as physiology, life history, and space use.[4][8][9][10]
By 2019 methods in eDNA research had been expanded to be able to assess whole communities from a single sample. This process involves metabarcoding, which can be precisely defined as the use of general or universal polymerase chain reaction (PCR) primers on mixed DNA samples from any origin followed by high-throughput next-generation sequencing (NGS) to determine the species composition of the sample. This method has been common in microbiology for years, but, as of 2020, it is only just finding its footing in the assessment of macroorganisms.[11][12][13] Ecosystem-wide applications of eDNA metabarcoding have the potential to not only describe communities and biodiversity, but also to detect interactions and functional ecology over large spatial scales, though it may be limited by false readings due to contamination or other errors.[7][14][12][9] Altogether, eDNA metabarcoding increases speed, accuracy, and identification over traditional barcoding and decreases cost, but needs to be standardized and unified, integrating taxonomy and molecular methods for full ecological study.[11][15][16][17][9][10]


with environmental DNA metabarcoding [10]
eDNA metabarcoding has applications to diversity monitoring across all habitats and taxonomic groups, ancient ecosystem reconstruction, plant-pollinator interactions, diet analysis, invasive species detection, pollution responses, and air quality monitoring. eDNA metabarcoding is a unique method still in development and will likely remain in flux for some time as technology advances and procedures become standardized. However, as metabarcoding is optimized and its use becomes more widespread, it is likely to become an essential tool for ecological monitoring and global conservation study.[10]
Community DNA[edit]
Since the inception of high‐throughput sequencing (HTS),[19] the use of metabarcoding as a biodiversity detection tool has drawn immense interest.[12][20] However, there has yet to be clarity regarding what source material is used to conduct metabarcoding analyses (e.g., environmental DNA versus community DNA). Without clarity between these two source materials, differences in sampling, as well as differences in laboratory procedures, can impact subsequent bioinformatics pipelines used for data processing, and complicate the interpretation of spatial and temporal biodiversity patterns. Here, we seek to clearly differentiate among the prevailing source materials used and their effect on downstream analysis and interpretation for environmental DNA metabarcoding of animals and plants compared to that of community DNA metabarcoding.[13]
With community DNA metabarcoding of animals and plants, the targeted groups are most often collected in bulk (e.g., soil, malaise trap or net), and individuals are removed from other sample debris and pooled together prior to bulk DNA extraction.[12] In contrast, macro‐organism eDNA is isolated directly from an environmental material (e.g., soil or water) without prior segregation of individual organisms or plant material from the sample and implicitly assumes that the whole organism is not present in the sample. Of course, community DNA samples may contain DNA from parts of tissues, cells and organelles of other organisms (e.g., gut contents, cutaneous intracellular or extracellular DNA). Likewise, macro‐organism eDNA samples may inadvertently capture whole microscopic nontarget organisms (e.g., protists, bacteria). Thus, the distinction can at least partly break down in practice.[13]
Another important distinction between community DNA and macro‐organism eDNA is that sequences generated from community DNA metabarcoding can be taxonomically verified when the specimens are not destroyed in the extraction process. Here, sequences can then be generated from voucher specimens using Sanger sequencing. As the samples for eDNA metabarcoding lack whole organisms, no such in situ comparisons can be made. Taxonomic affinities can therefore only be established by directly comparing obtained sequences (or through bioinformatically generated operational taxonomic units (MOTUs)), to sequences that are taxonomically annotated such as NCBI's GenBank nucleotide database,[21] BOLD,[22] or to self‐generated reference databases from Sanger‐sequenced DNA.[23][24][25] (The molecular operational taxonomic unit (MOTU) is a group identified through use of cluster algorithms and a predefined percentage sequence similarity, for example, 97%)).[26][13] Then, to at least partially corroborate the resulting list of taxa, comparisons are made with conventional physical, acoustic or visual‐based survey methods conducted at the same time or compared with historical records from surveys for a location (see Table 1).[13]
The difference in source material between community DNA and eDNA therefore has distinct ramifications for interpreting the scale of inference for time and space about the biodiversity detected. From community DNA, it is clear that the individual species were found in that time and place, but for eDNA, the organism that produced the DNA may be upstream from the sampled location,[27] or the DNA may have been transported in the faeces of a more mobile predatory species (e.g., birds depositing fish eDNA,[28] or was previously present, but no longer active in the community and detection is from DNA that was shed years to decades before.[29] The latter means that the scale of inference both in space and in time must be considered carefully when inferring the presence for the species in the community based on eDNA.[13]
Metabarcoding stages[edit]

There are six stages or steps in DNA barcoding and metabarcoding. The DNA barcoding of animals (and specifically of bats) is used as an example in the diagram at the right and in the discussion immediately below.
First, suitable DNA barcoding regions are chosen to answer some specific research question. The most commonly used DNA barcode region for animals is a segment about 600 base pairs long of the mitochondrial gene cytochrome oxidase I (CO1).[2] This locus provides large sequence variation between species yet relatively small amount of variation within species.[31] Other commonly used barcode regions used for species identification of animals are ribosomal DNA (rDNA) regions such as 16S, 18S and 12S and mitochondrial regions such as cytochrome B.[32][33][34][35] These markers have advantages and disadvantages and are used for different purposes.[36][37] Longer barcode regions (at least 600 base pairs long) are often needed for accurate species delimitation, especially to differentiate close relatives. Identification of the producer of organism's remains such as faeces, hairs and saliva can be used as a proxy measure to verify absence/presence of a species in an ecosystem. The DNA in these remains is usually of low quality and quantity, and therefore, shorter barcodes of around 100 base pairs long are used in these cases. Similarly, DNA remains in dung are often degraded as well, so short barcodes are needed to identify prey consumed.[30]
Second, a reference database needs to be built of all DNA barcodes likely to occur in a study. Ideally, these barcodes need to be generated from vouchered specimens deposited in a publicly accessible place, such as for instance a natural history museum or another research institute.[30] Building up such reference databases is currently being done all over the world. Partner organizations collaborate in international projects such as the International Barcode of Life Project (iBOL) and Consortium for the Barcode of Life (CBOL), aiming to construct a DNA barcode reference that will be the foundation for DNA‐based identification of the world's biome. Well‐known barcode repositories are NCBI GenBank and the Barcode of Life Data System (BOLD).[30]
Third, the cells containing the DNA of interest must be broken open to expose its DNA. This step, DNA extractions and purifications, should be performed from the substrate under investigation. There are several procedures available for this.[38] Specific techniques must be chosen to isolate DNA from substrates with partly degraded DNA, for example fossil samples, and samples containing inhibitors, such as blood, faeces and soil. Extractions in which DNA yield or quality is expected to be low should be carried out in an ancient DNA facility, together with established protocols to avoid contamination with modern DNA.[39][40] Experiments should always be performed in duplicate [41] and with positive controls included.[30]
Fourth, amplicons have to be generated from DNA extracted, either from a single specimen or from complex mixtures with primers based on DNA barcodes selected under step 1. To keep track of their origin, labelled nucleotides (molecular IDs or MID labels) need to be added in case of metabarcoding. These labels are needed later on in the analyses to trace reads from a bulk data set back to their origin.[30]

Fifth, the appropriate techniques should be chosen for DNA sequencing. The classic Sanger chain‐termination method relies on the selective incorporation of chain‐elongating inhibitors of DNA polymerase during DNA replication. These four bases are separated by size using electrophoresis and later identified by laser detection. The Sanger method is limited and can produce a single read at the same time and is therefore suitable to generate DNA barcodes from substrates that contain only a single species.[30] Emerging technologies such as nanopore sequencing have resulted in the cost of DNA sequencing reducing from about USD 30,000 per megabyte in 2002 to about USD 0.60 in 2016.[43][44] Modern next-generation sequencing (NGS) technologies can handle thousands to millions reads in parallel and are therefore suitable for mass identification of a mix of different species present in a substrate, summarized as metabarcoding.[30]
Finally, bioinformatic analyses need to be carried out to match DNA barcodes obtained with Barcode Index Numbers (BINs) in reference libraries.[45] Each BIN, or BIN cluster, can be identified to species level when it shows high (>97%) concordance with DNA barcodes linked to a species present in a reference library, or when taxonomic identification to the species level is still lacking, an operational taxonomic unit (OTU), which refers to a group of species (i.e. genus, family or higher taxonomic rank).[30] (See binning (metagenomics)). The results of the bioinformatics pipeline must be pruned, for example by filtering out unreliable singletons, superfluous duplicates, low‐quality reads and/or chimeric reads. This is generally done by carrying out serial BLAST searches in combination with automatic filtering and trimming scripts.[46] Standardized thresholds are needed to discriminate between different species or a correct and a wrong identification.[30]
Metabarcoding workflow[edit]
Despite the obvious power of the approach, eDNA metabarcoding is affected by precision and accuracy challenges distributed throughout the workflow in the field, in the laboratory and at the keyboard.[47] As set out in the diagram at the right, following the initial study design (hypothesis/question, targeted taxonomic group etc) the current eDNA workflow consists of three components: field, laboratory and bioinformatics.[13] The field component consists of sample collection (e.g., water, sediment, air) that is preserved or frozen prior to DNA extraction. The laboratory component has four basic steps: (i) DNA is concentrated (if not performed in the field) and purified, (ii) PCR is used to amplify a target gene or region, (iii) unique nucleotide sequences called "indexes" (also referred to as "barcodes") are incorporated using PCR or are ligated (bound) onto different PCR products, creating a "library" whereby multiple samples can be pooled together, and (iv) pooled libraries are then sequenced on a high‐throughput machine. The final step after laboratory processing of samples is to computationally process the output files from the sequencer using a robust bioinformatics pipeline.[13]

of an environmental DNA metabarcoding study [13]

OTUs and the species concept[edit]
This section is empty. You can help by adding to it. (March 2021) |
Method and visualisation[edit]

b) Beta diversity patterns illustrated via Principal Coordinate Analyses carried out in QIIME,[48] where each dot represents a sample and colors distinguish different classes of sample. The closer two sample points in 3D space, the more similar their community assemblages
c) GraPhalAn phylogenetic visualization of environmental data, with circular heatmaps and abundance bars used to convey quantitative taxon traits.[49]
d) Edge PCA, a tree‐based diversity metric that identifies specific lineages (green/orange branches) that contribute most to community changes observed in samples distributed across different PCA axes.[50][51]
The method requires each collected DNA to be archived with its corresponding "type specimen" (one for each taxon), in addition to the usual collection data. These types are stored in specific institutions (museums, molecular laboratories, universities, zoological gardens, botanical gardens, herbaria, etc.) one for each country, and in some cases, the same institution is assigned to contain the types of more than a country, in cases where some nations do not have the technology or financial resources to do so.
In this way, the creation of type specimens of genetic codes represents a methodology parallel to that carried out by traditional taxonomy.
In a first stage, the region of the DNA that would be used to make the barcode was defined. It had to be short and achieve a high percentage of unique sequences. For animals, algae and fungi, a portion of a mitochondrial gene which codes for subunit 1 of the cytochrome oxidase enzyme, CO1, has provided high percentages (95%), a region around 648 base pairs.[52]
In the case of plants, the use of CO1 has not been effective since they have low levels of variability in that region, in addition to the difficulties that are produced by the frequent effects of polyploidy, introgression, and hybridization, so the chloroplast genome seems more suitable .[53][54]
Applications[edit]
Pollinator networks[edit]

(a,b) plant-pollinator groups
(c,d) plant-pollinator species
(e,f) individual pollinator-plant species
(Empis leptempis pandellei)
Line thickness highlights the proportion of interactions
The diagram on the right shows a comparison of pollination networks based on DNA metabarcoding with more traditional networks based on direct observations of insect visits to plants. By detecting numerous additional hidden interactions, metabarcoding data largely alters the properties of the pollination networks compared to visit surveys. Molecular data shows that pollinators are much more generalist than expected from visit surveys. However, pollinator species were composed of relatively specialized individuals and formed functional groups highly specialized upon floral morphs.[55]
As a consequence of the ongoing global changes, a dramatic and parallel worldwide decline in pollinators and animal-pollinated plant species has been observed.[56] Understanding the responses of pollination networks to these declines is urgently required to diagnose the risks the ecosystems may incur as well as to design and evaluate the effectiveness of conservation actions.[57] Early studies on animal pollination dealt with simplified systems, i.e. specific pairwise interactions or involved small subsets of plant-animal communities. However, the impacts of disturbances occur through highly complex interaction networks [58] and, nowadays, these complex systems are currently a major research focus. Assessing the true networks (determined by ecological process) from field surveys that are subject to sampling effects still provides challenges.[59][55]
Recent research studies have clearly benefited from network concepts and tools to study the interaction patterns in large species assemblages.[60] They showed that plant-pollinator networks were highly structured, deviating significantly from random associations.[61] Commonly, networks have (1) a low connectance (the realized fraction of all potential links in the community) suggesting a low degree of generalization; (2) a high nestedness (the more-specialist organisms are more likely to interact with subsets of the species that more-generalist organisms interact with) the more specialist species interact only with proper subsets of those species interacting with the more generalist ones;[62] (3) a cumulative distribution of connectivity (number of links per species, s) that follows a power or a truncated power law function [63] characterized by few supergeneralists with more links than expected by chance and many specialists; (4) a modular organization. A module is a group of plant and pollinator species that exhibits high levels of within-module connectivity, and that is poorly connected to species of other groups.[64][55]
The low level of connectivity and the high proportion of specialists in pollination networks contrast with the view that generalization rather than specialization is the norm in networks.[65][66] Indeed, most plants species are visited by a diverse array of pollinators which exploit floral resources from a wide range of plant species.[67][68] A main cause evoked to explain this apparent contradiction is the incomplete sampling of interactions.[69] Indeed, most network properties are highly sensitive to sampling intensity and network size.[61] Network studies are basically phytocentric i.e. based on the observations of pollinator visits to flowers. This plant-centered approach suffers nevertheless from inherent limitations which may hamper the comprehension of mechanisms contributing to community assembly and biodiversity patterns. First, direct observations of pollinator visits to certain taxa such as orchids are often scarce [70] and rare interactions are very difficult to detect in field in general.[57][58][59][60] Pollinator and plant communities usually are composed of few abundant species and many rare species that are poorly recorded in visit surveys.[71][72] These rare species appear as specialists, whereas in fact they could be typical generalists. Because of the positive relationship between interaction frequency (f) and connectivity (s), undersampled interactions may lead to overestimating the degree of specialization in networks.[73] Second, network analyses have mostly operated at species levels. Networks have very rarely been up scaled to the functional groups or down scaled to the individual-based networks,[74] and most of them have been focused on one or two species only. The behavior of either individuals or colonies is commonly ignored, although it may influence the structure of the species networks.[74] Species accounted as generalists in species networks could, therefore, entail cryptic specialized individuals or colonies. Third, flower visitors are by no means always effective pollinators as they may deposit no conspecific pollen and/or a lot of heterospecific pollen.[75][76] Animal-centered approaches based on the investigation of pollen loads on visitors and plant stigmas may be more efficient at revealing plant-pollinator interactions.[75][76][55]
Disentangling food webs[edit]

(A) Trophic network:
of arthropod and vertebrate predators – arrows represent biomass flow between predators and preys.
(B) Intraguild interactions: * Arthropod predators * Parasitoids of arthropods: * Insectivorous vertebrates:[77]
Metabarcoding offers new opportunities for deciphering trophic linkages between predators and their prey within food webs.[78][79] Compared to traditional, time-consuming methods, such as microscopic or serological analyses, the development of DNA metabarcoding allows the identification of prey species without prior knowledge of the predator’s prey range.[80] In addition, metabarcoding can also be used to characterize a large number of species in a single PCR reaction, and to analyze several hundred samples simultaneously.[6] Such an approach is increasingly used to explore the functional diversity and structure of food webs in agroecosystems.[79][81][82][83][84] Like other molecular-based approaches, metabarcoding only gives qualitative results on the presence/absence of prey species in the gut or fecal samples.[85] However, this knowledge of the identity of prey consumed by predators of the same species in a given environment enables a "pragmatic and useful surrogate for truly quantitative information.[86][77]
In food web ecology, "who eats whom" is a fundamental issue for gaining a better understanding of the complex trophic interactions existing between pests and their natural enemies within a given ecosystem.[36][87] The dietary analysis of arthropod and vertebrate predators allows the identification of key predators involved in the natural control of arthropod pests and gives insights into the breadth of their diet (generalist vs. specialist) and intraguild predation.[77]
The diagram on the right summarises results from a 2020 study which used metabarcoding to untangle the functional diversity and structure of the food web associated with a couple of millet fields in Senegal. After assigning the identified OTUs as species, 27 arthropod prey taxa were identified from nine arthropod predators. The mean number of prey taxa detected per sample was the highest in carabid beetles, ants and spiders, and the lowest in the remaining predators including anthocorid bugs, pentatomid bugs, and earwigs. Across predatory arthropods, a high diversity of arthropod preys was observed in spiders, carabid beetles, ants, and anthocorid bugs. In contrast, the diversity of prey species identified in earwigs and pentatomid bugs was relatively low. Lepidoptera, Hemiptera, Diptera and Coleoptera were the most common insect prey taxa detected from predatory arthropods.[77]
Conserving functional biodiversity and related ecosystem services, especially by controlling pests using their natural enemies, offers new avenues to tackle challenges for the sustainable intensification of food production systems.[88][89][90] Predation of crop pests by generalist predators, including arthropods and vertebrates, is a major component of natural pest control.[91] A particularly important trait of most generalist predators is that they can colonize crops early in the season by first feeding on alternative prey.[92][93] However, the breadth of the "generalist" diet entails some drawbacks for pest control, such as intra-guild predation.[91][94][95] A tuned diagnosis of diet breadth in generalist predators, including predation of non-pest prey, is thus needed to better disentangle food webs (e.g., exploitation competition and apparent competition) and ultimately to identify key drivers of natural pest control in agroecosystems. However, the importance of generalist predators in the food web is generally difficult to assess, due to the ephemeral nature of individual predator–prey interactions.[94][96] The only conclusive evidence of predation results from direct observation of prey consumption, identification of prey residues within predators’ guts,[94] and analyses of regurgitates[97] or feces.[98][77]
Marine biosecurity[edit]

.jpeg)


The spread of non-indigenous species (NIS) represents significant and increasing risks to ecosystems.[100] In marine systems, NIS that survive the transport and adapt to new locations can have significant adverse effects on local biodiversity, including the displacement of native species, and shifts in biological communities and associated food webs.[101][102] Once NIS are established, they are extremely difficult and costly to eradicate,[103][104] and further regional spread may occur through natural dispersal or via anthropogenic transport pathways.[104][105][106] While vessel hull fouling and ships’ ballast waters are well known as important anthropogenic pathways for the international spread of NIS,[100][107][108][109] comparatively little is known about the potential of regionally transiting vessels to contribute to the secondary spread of marine pests through bilge water translocation.[99]
Recent studies have revealed that the water and associated debris entrained in bilge spaces of small vessels (<20 m) can act as a vector for the spread of NIS at regional scales.[110][111][112][113][114][115] Bilge water is defined as any water that is retained on a vessel (other than ballast), and that is not deliberately pumped on board. It can accumulate on or below the vessel’s deck (e.g., under floor panels) through a variety of mechanisms, including wave actions, leaks, via the propeller stern glands, and through the loading of items such as diving, fishing, aquaculture or scientific equipment.[116] Bilge water, therefore, may contain seawater as well as living organisms at various life stages, cell debris and contaminants (e.g., oil, dirt, detergent, etc.), all of which are usually discharged using automatic bilge pumps or are self-drained using duckbill valves. Bilge water pumped from small vessels (manually or automatically) is not usually treated prior to discharge to sea, contrasting with larger vessels that are required to separate oil and water using filtration systems, centrifugation, or carbon absorption.[116][117] If propagules are viable through this process, the discharge of bilge water may result in the spread of NIS.[99]
In 2017, Fletcher et al. used a combination of laboratory and field experiments to investigate the diversity, abundance, and survival of biological material contained in bilge water samples taken from small coastal vessels.[115] Their laboratory experiment showed that ascidian colonies or fragments, and bryozoan larvae, can survive passage through an unfiltered pumping system largely unharmed. They also conducted the first morpho-molecular assessment (using eDNA metabarcoding) on the biosecurity risk posed by bilge water discharges from 30 small vessels (sailboats and motorboats) of various origins and sailing time. Using eDNA metabarcoding they characterised approximately three times more taxa than via traditional microscopic methods, including the detection of five species recognised as non-indigenous in the study region.[99]
To assist in understanding the risks associated with different NIS introduction vectors, traditional microscope biodiversity assessments are increasingly being complemented by eDNA metabarcoding.[118][119][120][121] This allows a wide range of diverse taxonomic assemblages, at many life stages to be identified. It can also enable the detection of NIS that may have been overlooked using traditional methods. Despite the great potential of eDNA metabarcoding tools for broad-scale taxonomic screening,[122][123] a key challenge for eDNA in the context of environmental monitoring of marine pests, and particularly when monitoring enclosed environments such as some bilge spaces or ballast tanks, is differentiating dead and viable organisms.[124] Extracellular DNA can persist in dark/cold environments for extended periods of time (months to years,[125][126] thus many of the organisms detected using eDNA metabarcoding may have not been viable in the location of sample collection for days or weeks. In contrast, ribonucleic acid (RNA) deteriorates rapidly after cell death, likely providing a more accurate representation of viable communities.[127] Recent metabarcoding studies have explored the use of co-extracted eDNA and eRNA molecules for monitoring benthic sediment samples around marine fish farms and oil drilling sites,[128][129][130][131][132] and have collectively found slightly stronger correlations between biological and physico-chemical variables along impact gradients when using eRNA. From a marine biosecurity prospective, the detection of living NIS may represent a more serious and immediate threat than the detection of NIS based purely on a DNA signal. Environmental RNA may therefore offer a useful method for identifying living organisms in samples.[99]
Miscellaneous[edit]
The construction of the genetic barcode library was initially focused on fish [133] and the birds,[134][135][136] which were followed by butterflies and other invertebrates.[137] In the case of birds, the DNA sample is usually obtained from the chest.
Researchers have already developed specific catalogs for large animal groups, such as bees, birds, mammals or fish. Another use is to analyze the complete zoocenosis of a given geographic area, such as the "Polar Life Bar Code" project that aims to collect the genetic traits of all organisms that live in polar regions; both poles of the Earth. Related to this form is the coding of all the ichthyofauna of a hydrographic basin, for example the one that began to develop in the Rio São Francisco, in the northeast of Brazil.[138][139]
The potential of the use of Barcodes is very wide, since the discovery of numerous cryptic species (it has already yielded numerous positive results),[140] the use in the identification of species at any stage of their life, the secure identification in cases of protected species that are illegally trafficked, etc.[141][142]
It has also been used as a non-invasive tool to determine the diet of critically endangered species, such as the northern hairy-nosed wombat (Lasiorhinus krefftii).[143]
Potentials and shortcomings[edit]

Potentials[edit]
DNA barcoding has been proposed as a way to distinguish species suitable even for non-specialists to use.[144]
Shortcomings[edit]
In general, the shortcomings for DNA barcoding are valid also for metabarcoding. One particular drawback for metabarcoding studies is that there is no consensus yet regarding the optimal experimental design and bioinformatics criteria to be applied in eDNA metabarcoding.[145] However, there are current joined attempts, such as the COST network DNAqua-Net of the European Cooperation in Science and Technology,[146] to move forward by exchanging experience and knowledge to establish best-practice standards for biomonitoring.[147]
The so-called barcode is a region of mitochondrial DNA within the gene for cytochrome c oxidase. A database, Barcode of Life Data Systems (BOLD), contains DNA barcode sequences from over 190,000 species.[148][149] However, scientists such as Rob DeSalle have expressed concern that classical taxonomy and DNA barcoding, which they consider a misnomer, need to be reconciled, as they delimit species differently.[150] Genetic introgression mediated by endosymbionts and other vectors can further make barcodes ineffective in the identification of species.[151]
Status of barcode species[edit]
In microbiology, genes can move freely even between distantly related bacteria, possibly extending to the whole bacterial domain. As a rule of thumb, microbiologists have assumed that kinds of Bacteria or Archaea with 16S ribosomal RNA gene sequences more similar than 97% to each other need to be checked by DNA-DNA hybridisation to decide if they belong to the same species or not.[152] This concept was narrowed in 2006 to a similarity of 98.7%.[153]
DNA-DNA hybridisation is outdated, and results have sometimes led to misleading conclusions about species, as with the pomarine and great skua.[154][155] Modern approaches compare sequence similarity using computational methods.[156]
See also[edit]
- Barcode of Life Data System (BOLD)
- Consortium for the Barcode of Life (CBOL)
- International Nucleotide Sequence Database Collaboration (INSDC)
- Molecular marker
- Taxonomic impediment
References[edit]
- ^ Pierre, Taberlet (2 February 2018). Environmental DNA : for biodiversity research and monitoring. Bonin, Aurelie, 1979-. Oxford. ISBN 9780191079993. OCLC 1021883023.
{{cite book}}: CS1 maint: location missing publisher (link) - ^ a b Hebert, Paul D. N.; Cywinska, Alina; Ball, Shelley L.; Dewaard, Jeremy R. (2003). "Biological identifications through DNA barcodes". Proceedings of the Royal Society of London. Series B: Biological Sciences. 270 (1512): 313–321. doi:10.1098/rspb.2002.2218. PMC 1691236. PMID 12614582.
- ^ Ficetola, Gentile Francesco; Miaud, Claude; Pompanon, François; Taberlet, Pierre (2008). "Species detection using environmental DNA from water samples". Biology Letters. 4 (4): 423–425. doi:10.1098/rsbl.2008.0118. PMC 2610135. PMID 18400683.
- ^ a b c Barnes, Matthew A.; Turner, Cameron R. (2016). "The ecology of environmental DNA and implications for conservation genetics". Conservation Genetics. 17: 1–17. doi:10.1007/s10592-015-0775-4. hdl:2346/87600. S2CID 14914544.
- ^ Deiner, Kristy; Walser, Jean-Claude; Mächler, Elvira; Altermatt, Florian (2015). "Choice of capture and extraction methods affect detection of freshwater biodiversity from environmental DNA". Biological Conservation. 183: 53–63. doi:10.1016/j.biocon.2014.11.018.
- ^ a b Taberlet, Pierre; Coissac, Eric; Pompanon, François; Brochmann, Christian; Willerslev, Eske (2012). "Towards next-generation biodiversity assessment using DNA metabarcoding". Molecular Ecology. 21 (8): 2045–2050. doi:10.1111/j.1365-294X.2012.05470.x. PMID 22486824. S2CID 41437334.
- ^ a b Bohmann, Kristine; Evans, Alice; Gilbert, M. Thomas P.; Carvalho, Gary R.; Creer, Simon; Knapp, Michael; Yu, Douglas W.; De Bruyn, Mark (2014). "Environmental DNA for wildlife biology and biodiversity monitoring". Trends in Ecology & Evolution. 29 (6): 358–367. doi:10.1016/j.tree.2014.04.003. PMID 24821515.
- ^ Goldberg, Caren S.; Turner, Cameron R.; Deiner, Kristy; Klymus, Katy E.; Thomsen, Philip Francis; Murphy, Melanie A.; Spear, Stephen F.; McKee, Anna; Oyler‐Mccance, Sara J.; Cornman, Robert Scott; Laramie, Matthew B.; Mahon, Andrew R.; Lance, Richard F.; Pilliod, David S.; Strickler, Katherine M.; Waits, Lisette P.; Fremier, Alexander K.; Takahara, Teruhiko; Herder, Jelger E.; Taberlet, Pierre (2016). "Critical considerations for the application of environmental DNA methods to detect aquatic species". Methods in Ecology and Evolution. 7 (11): 1299–1307. doi:10.1111/2041-210X.12595. hdl:20.500.11850/502281.
- ^ a b c Hering, Daniel; Borja, Angel; Jones, J.Iwan; Pont, Didier; Boets, Pieter; Bouchez, Agnes; Bruce, Kat; Drakare, Stina; Hänfling, Bernd; Kahlert, Maria; Leese, Florian; Meissner, Kristian; Mergen, Patricia; Reyjol, Yorick; Segurado, Pedro; Vogler, Alfried; Kelly, Martyn (2018). "Implementation options for DNA-based identification into ecological status assessment under the European Water Framework Directive". Water Research. 138: 192–205. Bibcode:2018WatRe.138..192H. doi:10.1016/j.watres.2018.03.003. PMID 29602086. S2CID 5008250.
- ^ a b c d e Ruppert, Krista M.; Kline, Richard J.; Rahman, Md Saydur (2019). "Past, present, and future perspectives of environmental DNA (EDNA) metabarcoding: A systematic review in methods, monitoring, and applications of global eDNA". Global Ecology and Conservation. 17: e00547. doi:10.1016/j.gecco.2019.e00547.
 Material was copied from this source, which is available under a Creative Commons Attribution 4.0 International License
 - ^ a b Coissac, Eric; Riaz, Tiayyba; Puillandre, Nicolas (2012). "Bioinformatic challenges for DNA metabarcoding of plants and animals". Molecular Ecology. 21 (8): 1834–1847. doi:10.1111/j.1365-294X.2012.05550.x. PMID 22486822. S2CID 24398174.
- ^ a b c d e f g Creer, Simon; Deiner, Kristy; Frey, Serita; Porazinska, Dorota; Taberlet, Pierre; Thomas, W. Kelley; Potter, Caitlin; Bik, Holly M. (2016). "The ecologist's field guide to sequence‐based identification of biodiversity". Methods in Ecology and Evolution. 7 (9): 1008–1018. doi:10.1111/2041-210X.12574. hdl:20.500.11850/125378. Material was copied from this source, which is available under a Creative Commons Attribution 4.0 International License
- ^ a b c d e f g h i Deiner, Kristy; Bik, Holly M.; Mächler, Elvira; Seymour, Mathew; Lacoursière‐Roussel, Anaïs; Altermatt, Florian; Creer, Simon; Bista, Iliana; Lodge, David M.; Vere, Natasha; Pfrender, Michael E.; Bernatchez, Louis (2017). "Environmental DNA metabarcoding: Transforming how we survey animal and plant communities". Molecular Ecology. 26 (21): 5872–5895. doi:10.1111/mec.14350. hdl:20.500.11850/455284. PMID 28921802. S2CID 8001074. Material was copied from this source, which is available under a Creative Commons Attribution 4.0 International License
- ^ Ficetola, Gentile Francesco; Taberlet, Pierre; Coissac, Eric (2016). "How to limit false positives in environmental DNA and metabarcoding?". Molecular Ecology Resources. 16 (3): 604–607. doi:10.1111/1755-0998.12508. PMID 27062589. S2CID 785279.
- ^ Yu, Douglas W.; Ji, Yinqiu; Emerson, Brent C.; Wang, Xiaoyang; Ye, Chengxi; Yang, Chunyan; Ding, Zhaoli (2012). "Biodiversity soup: Metabarcoding of arthropods for rapid biodiversity assessment and biomonitoring". Methods in Ecology and Evolution. 3 (4): 613–623. doi:10.1111/j.2041-210X.2012.00198.x. hdl:10261/193380.
- ^ Cristescu, Melania E. (2014). "From barcoding single individuals to metabarcoding biological communities: Towards an integrative approach to the study of global biodiversity". Trends in Ecology & Evolution. 29 (10): 566–571. doi:10.1016/j.tree.2014.08.001. PMID 25175416. S2CID 18352572.
- ^ Gibson, Joel F.; Shokralla, Shadi; Curry, Colin; Baird, Donald J.; Monk, Wendy A.; King, Ian; Hajibabaei, Mehrdad (2015). "Large-Scale Biomonitoring of Remote and Threatened Ecosystems via High-Throughput Sequencing". PLOS ONE. 10 (10): e0138432. Bibcode:2015PLoSO..1038432G. doi:10.1371/journal.pone.0138432. PMC 4619546. PMID 26488407.
- ^ Chua, Physilia Y. S.; Bourlat, Sarah J.; Ferguson, Cameron; Korlevic, Petra; Zhao, Leia; Ekrem, Torbjørn; Meier, Rudolf; Lawniczak, Mara K. N. (10 March 2023). "Future of DNA-based insect monitoring". Trends in Genetics. 39 (7): 531–544. doi:10.1016/j.tig.2023.02.012. PMID 36907721. S2CID 257470926.
- ^ Margulies, Marcel; et al. (2005). "Genome sequencing in microfabricated high-density picolitre reactors". Nature. 437 (7057): 376–380. Bibcode:2005Natur.437..376M. doi:10.1038/nature03959. PMC 1464427. PMID 16056220.
- ^ Hajibabaei, Mehrdad; Shokralla, Shadi; Zhou, Xin; Singer, Gregory A. C.; Baird, Donald J. (2011). "Environmental Barcoding: A Next-Generation Sequencing Approach for Biomonitoring Applications Using River Benthos". PLOS ONE. 6 (4): e17497. Bibcode:2011PLoSO...617497H. doi:10.1371/journal.pone.0017497. PMC 3076369. PMID 21533287.
- ^ Benson, Dennis A.; Cavanaugh, Mark; Clark, Karen; Karsch-Mizrachi, Ilene; Lipman, David J.; Ostell, James; Sayers, Eric W. (2012). "Gen Bank". Nucleic Acids Research. 41 (Database issue): D36–D42. doi:10.1093/nar/gks1195. PMC 3531190. PMID 23193287.
- ^ Pruesse, E.; Quast, C.; Knittel, K.; Fuchs, B. M.; Ludwig, W.; Peplies, J.; Glockner, F. O. (2007). "SILVA: A comprehensive online resource for quality checked and aligned ribosomal RNA sequence data compatible with ARB". Nucleic Acids Research. 35 (21): 7188–7196. doi:10.1093/nar/gkm864. PMC 2175337. PMID 17947321.
- ^ o'Donnell, James L.; Kelly, Ryan P.; Lowell, Natalie C.; Port, Jesse A. (2016). "Indexed PCR Primers Induce Template-Specific Bias in Large-Scale DNA Sequencing Studies". PLOS ONE. 11 (3): e0148698. Bibcode:2016PLoSO..1148698O. doi:10.1371/journal.pone.0148698. PMC 4780811. PMID 26950069.
- ^ Sønstebø, J. H.; Gielly, L.; Brysting, A. K.; Elven, R.; Edwards, M.; Haile, J.; Willerslev, E.; Coissac, E.; Rioux, D.; Sannier, J.; Taberlet, P.; Brochmann, C. (2010). "Using next‐generation sequencing for molecular reconstruction of past Arctic vegetation and climate". Molecular Ecology Resources. 10 (6): 1009–1018. doi:10.1111/j.1755-0998.2010.02855.x. PMID 21565110. S2CID 23029234.
- ^ Willerslev, Eske; et al. (2014). "Fifty thousand years of Arctic vegetation and megafaunal diet" (PDF). Nature. 506 (7486): 47–51. Bibcode:2014Natur.506...47W. doi:10.1038/nature12921. PMID 24499916. S2CID 4461741.
- ^ Blaxter, Mark; Mann, Jenna; Chapman, Tom; Thomas, Fran; Whitton, Claire; Floyd, Robin; Abebe, Eyualem (2005). "Defining operational taxonomic units using DNA barcode data". Philosophical Transactions of the Royal Society B: Biological Sciences. 360 (1462): 1935–1943. doi:10.1098/rstb.2005.1725. PMC 1609233. PMID 16214751.
- ^ Deiner, Kristy; Altermatt, Florian (2014). "Transport Distance of Invertebrate Environmental DNA in a Natural River". PLOS ONE. 9 (2): e88786. Bibcode:2014PLoSO...988786D. doi:10.1371/journal.pone.0088786. PMC 3921251. PMID 24523940.
- ^ Merkes, Christopher M.; McCalla, S. Grace; Jensen, Nathan R.; Gaikowski, Mark P.; Amberg, Jon J. (2014). "Persistence of DNA in Carcasses, Slime and Avian Feces May Affect Interpretation of Environmental DNA Data". PLOS ONE. 9 (11): e113346. Bibcode:2014PLoSO...9k3346M. doi:10.1371/journal.pone.0113346. PMC 4234652. PMID 25402206.
- ^ Yoccoz, N. G.; Bråthen, K. A.; Gielly, L.; Haile, J.; Edwards, M. E.; Goslar, T.; von Stedingk, H.; Brysting, A. K.; Coissac, E.; Pompanon, F.; Sønstebø, J. H.; Miquel, C.; Valentini, A.; De Bello, F.; Chave, J.; Thuiller, W.; Wincker, P.; Cruaud, C.; Gavory, F.; Rasmussen, M.; Gilbert, M. T. P.; Orlando, L.; Brochmann, C.; Willerslev, E.; Taberlet, P. (2012). "DNA from soil mirrors plant taxonomic and growth form diversity". Molecular Ecology. 21 (15): 3647–3655. doi:10.1111/j.1365-294X.2012.05545.x. PMID 22507540.
- ^ a b c d e f g h i j Haarsma, Anne‐Jifke; Siepel, Henk; Gravendeel, Barbara (2016). "Added value of metabarcoding combined with microscopy for evolutionary studies of mammals". Zoologica Scripta. 45: 37–49. doi:10.1111/zsc.12214. hdl:2066/161842. S2CID 89048681. Material was copied from this source, which is available under a Creative Commons Attribution 4.0 International License
- ^ Kress, W. John; García-Robledo, Carlos; Uriarte, Maria; Erickson, David L. (2015). "DNA barcodes for ecology, evolution, and conservation". Trends in Ecology & Evolution. 30 (1): 25–35. doi:10.1016/j.tree.2014.10.008. PMID 25468359.
- ^ Galan, Maxime; Pagès, Marie; Cosson, Jean-François (2012). "Next-Generation Sequencing for Rodent Barcoding: Species Identification from Fresh, Degraded and Environmental Samples". PLOS ONE. 7 (11): e48374. Bibcode:2012PLoSO...748374G. doi:10.1371/journal.pone.0048374. PMC 3492341. PMID 23144869.
- ^ Ivanova, Natalia V.; Clare, Elizabeth L.; Borisenko, Alex V. (2012). "DNA Barcoding in Mammals". DNA Barcodes. Methods in Molecular Biology. Vol. 858. pp. 153–182. doi:10.1007/978-1-61779-591-6_8. ISBN 978-1-61779-590-9. PMID 22684956.
- ^ Clare, Elizabeth L. (2014). "Molecular detection of trophic interactions: Emerging trends, distinct advantages, significant considerations and conservation applications". Evolutionary Applications. 7 (9): 1144–1157. doi:10.1111/eva.12225. PMC 4231602. PMID 25553074.
- ^ Orlando, Ludovic; Hänni, Catherine; Douady, Christophe J. (2007). "Mammoth and Elephant Phylogenetic Relationships: Mammut Americanum, the Missing Outgroup". Evolutionary Bioinformatics. 3: 45–51. doi:10.1177/117693430700300019. PMC 2674638. PMID 19430604.
- ^ a b Pompanon, Francois; Deagle, Bruce E.; Symondson, William O. C.; Brown, David S.; Jarman, Simon N.; Taberlet, Pierre (2012). "Who is eating what: Diet assessment using next generation sequencing". Molecular Ecology. 21 (8): 1931–1950. doi:10.1111/j.1365-294X.2011.05403.x. PMID 22171763. S2CID 10013333.
- ^ Deagle, Bruce E.; Jarman, Simon N.; Coissac, Eric; Pompanon, François; Taberlet, Pierre (2014). "DNA metabarcoding and the cytochrome c oxidase subunit I marker: Not a perfect match". Biology Letters. 10 (9). doi:10.1098/rsbl.2014.0562. PMC 4190964. PMID 25209199.
- ^ Dhaliwal, Anandika (2013). "DNA Extraction and Purification". Materials and Methods. 3. doi:10.13070/mm.en.3.191.
- ^ Cooper, A.; Poinar, H. N. (2000). "Ancient DNA: Do It Right or Not at All". Science. 289 (5482): 1139b–1139. doi:10.1126/science.289.5482.1139b. PMID 10970224. S2CID 11030200.
- ^ Willerslev, Eske; Cooper, Alan (2005). "Review Paper. Ancient DNA". Proceedings of the Royal Society B: Biological Sciences. 272 (1558): 3–16. doi:10.1098/rspb.2004.2813. PMC 1634942. PMID 15875564.
- ^ Ficetola, Gentile F.; Pansu, Johan; Bonin, Aurélie; Coissac, Eric; Giguet-Covex, Charline; De Barba, Marta; Gielly, Ludovic; Lopes, Carla M.; Boyer, Frédéric; Pompanon, François; Rayé, Gilles; Taberlet, Pierre (2015). "Replication levels, false presences and the estimation of the presence/Absence from eDNA metabarcoding data". Molecular Ecology Resources. 15 (3): 543–556. doi:10.1111/1755-0998.12338. PMID 25327646. S2CID 24432585.
- ^ Yang, Aimin; Zhang, Wei; Wang, Jiahao; Yang, Ke; Han, Yang; Zhang, Limin (2020). "Review on the Application of Machine Learning Algorithms in the Sequence Data Mining of DNA". Frontiers in Bioengineering and Biotechnology. 8: 1032. doi:10.3389/fbioe.2020.01032. PMC 7498545. PMID 33015010.
- ^ Shendure, Jay; Aiden, Erez Lieberman (2012). "The expanding scope of DNA sequencing". Nature Biotechnology. 30 (11): 1084–1094. doi:10.1038/nbt.2421. PMC 4149750. PMID 23138308.
- ^ Panda, Darshan; Molla, Kutubuddin Ali; Baig, Mirza Jainul; Swain, Alaka; Behera, Deeptirekha; Dash, Manaswini (2018). "DNA as a digital information storage device: Hope or hype?". 3 Biotech. 8 (5): 239. doi:10.1007/s13205-018-1246-7. PMC 5935598. PMID 29744271.
- ^ Ratnasingham, S. (2013). "A DNA-based registry for all animal species: the Barcode Index Number (BIN) system". PLOS ONE. 8 (7): e66213. Bibcode:2013PLoSO...866213R. doi:10.1371/journal.pone.0066213. PMC 3704603. PMID 23861743.
- ^ Nelson, Karen E. (3 January 2015). Encyclopedia of Metagenomics: Genes, Genomes and Metagenomes. Basics, Methods, Databases and Tools. Springer. ISBN 9781489974778.
- ^ Abarenkov, Kessy; Henrik Nilsson, R.; Larsson, Karl-Henrik; Alexander, Ian J.; Eberhardt, Ursula; Erland, Susanne; Høiland, Klaus; Kjøller, Rasmus; Larsson, Ellen; Pennanen, Taina; Sen, Robin; Taylor, Andy F. S.; Tedersoo, Leho; Ursing, Björn M.; Vrålstad, Trude; Liimatainen, Kare; Peintner, Ursula; Kõljalg, Urmas (2010). "The UNITE database for molecular identification of fungi - recent updates and future perspectives". New Phytologist. 186 (2): 281–285. doi:10.1111/j.1469-8137.2009.03160.x. PMID 20409185.
- ^ Caporaso, J Gregory; Kuczynski, Justin; Stombaugh, Jesse; Bittinger, Kyle; Bushman, Frederic D.; Costello, Elizabeth K.; Fierer, Noah; Peña, Antonio Gonzalez; Goodrich, Julia K.; Gordon, Jeffrey I.; Huttley, Gavin A.; Kelley, Scott T.; Knights, Dan; Koenig, Jeremy E.; Ley, Ruth E.; Lozupone, Catherine A.; McDonald, Daniel; Muegge, Brian D.; Pirrung, Meg; Reeder, Jens; Sevinsky, Joel R.; Turnbaugh, Peter J.; Walters, William A.; Widmann, Jeremy; Yatsunenko, Tanya; Zaneveld, Jesse; Knight, Rob (2010). "QIIME allows analysis of high-throughput community sequencing data". Nature Methods. 7 (5): 335–336. doi:10.1038/nmeth.f.303. PMC 3156573. PMID 20383131.
- ^ Asnicar, Francesco; Weingart, George; Tickle, Timothy L.; Huttenhower, Curtis; Segata, Nicola (2015). "Compact graphical representation of phylogenetic data and metadata with GraPhl An". PeerJ. 3: e1029. doi:10.7717/peerj.1029. PMC 4476132. PMID 26157614.
- ^ Matsen Iv, Frederick A.; Evans, Steven N. (2013). "Edge Principal Components and Squash Clustering: Using the Special Structure of Phylogenetic Placement Data for Sample Comparison". PLOS ONE. 8 (3): e56859. Bibcode:2013PLoSO...856859M. doi:10.1371/journal.pone.0056859. PMC 3594297. PMID 23505415.
- ^ Darling, Aaron E.; Jospin, Guillaume; Lowe, Eric; Matsen, Frederick A.; Bik, Holly M.; Eisen, Jonathan A. (2014). "Phylo Sift: Phylogenetic analysis of genomes and metagenomes". PeerJ. 2: e243. doi:10.7717/peerj.243. PMC 3897386. PMID 24482762.
- ^ Stoeckle, M. Y. & Hebert, P. D. (2008). El código de barras de la vida. Investigación y ciencia, (387), 42-47.
- ^ Newmaster S. G. et al. (2007). Testing candidate plant barcode regions in Myristicaceae. Molecular Ecology Notes. 1-11.
- ^ Jaén-Molina, R., Caujapé-Castells, J., Fernández-Palacios, O., de Paz, J. P., Febles, R., Bramwell, D., ... & Khalik, K. A. Filogenia molecular de las Matthioleae Macaronésicas según la información de la región ITS.
- ^ a b c d e Pornon, André; Andalo, Christophe; Burrus, Monique; Escaravage, Nathalie (2017). "DNA metabarcoding data unveils invisible pollination networks". Scientific Reports. 7 (1): 16828. Bibcode:2017NatSR...716828P. doi:10.1038/s41598-017-16785-5. PMC 5715002. PMID 29203872. Material was copied from this source, which is available under a Creative Commons Attribution 4.0 International License
- ^ Biesmeijer, J. C.; Roberts, S. P.; Reemer, M.; Ohlemüller, R.; Edwards, M.; Peeters, T.; Schaffers, A. P.; Potts, S. G.; Kleukers, R.; Thomas, C. D.; Settele, J.; Kunin, W. E. (2006). "Parallel Declines in Pollinators and Insect-Pollinated Plants in Britain and the Netherlands". Science. 313 (5785): 351–354. Bibcode:2006Sci...313..351B. doi:10.1126/science.1127863. PMID 16857940. S2CID 16273738.
- ^ a b Hegland, Stein Joar; Dunne, Jennifer; Nielsen, Anders; Memmott, Jane (2010). "How to monitor ecological communities cost-efficiently: The example of plant–pollinator networks". Biological Conservation. 143 (9): 2092–2101. doi:10.1016/j.biocon.2010.05.018.
- ^ a b Jordano, Pedro (2016). "Chasing Ecological Interactions". PLOS Biology. 14 (9): e1002559. doi:10.1371/journal.pbio.1002559. PMC 5025190. PMID 27631692.
- ^ a b Vázquez, Diego P.; Chacoff, Natacha P.; Cagnolo, Luciano (2009). "Evaluating multiple determinants of the structure of plant–animal mutualistic networks". Ecology. 90 (8): 2039–2046. doi:10.1890/08-1837.1. hdl:11336/20750. PMID 19739366.
- ^ a b Bartomeus, Ignasi (2013). "Understanding Linkage Rules in Plant-Pollinator Networks by Using Hierarchical Models That Incorporate Pollinator Detectability and Plant Traits". PLOS ONE. 8 (7): e69200. Bibcode:2013PLoSO...869200B. doi:10.1371/journal.pone.0069200. PMC 3698228. PMID 23840909.
- ^ a b Blüthgen, Nico; Menzel, Florian; Hovestadt, Thomas; Fiala, Brigitte; Blüthgen, Nils (2007). "Specialization, Constraints, and Conflicting Interests in Mutualistic Networks". Current Biology. 17 (4): 341–346. doi:10.1016/j.cub.2006.12.039. PMID 17275300. S2CID 17241040.
- ^ Bascompte, J.; Jordano, P.; Melian, C. J.; Olesen, J. M. (2003). "The nested assembly of plant-animal mutualistic networks". Proceedings of the National Academy of Sciences. 100 (16): 9383–9387. Bibcode:2003PNAS..100.9383B. doi:10.1073/pnas.1633576100. PMC 170927. PMID 12881488.
- ^ Jordano, Pedro; Bascompte, Jordi; Olesen, Jens M. (2002). "Invariant properties in coevolutionary networks of plant-animal interactions". Ecology Letters. 6: 69–81. doi:10.1046/j.1461-0248.2003.00403.x. hdl:10261/41710.
- ^ Olesen, J. M.; Bascompte, J.; Dupont, Y. L.; Jordano, P. (2007). "The modularity of pollination networks". Proceedings of the National Academy of Sciences. 104 (50): 19891–19896. Bibcode:2007PNAS..10419891O. doi:10.1073/pnas.0706375104. PMC 2148393. PMID 18056808.
- ^ Ollerton, Jeff (1996). "Reconciling Ecological Processes with Phylogenetic Patterns: The Apparent Paradox of Plant--Pollinator Systems". Journal of Ecology. 84 (5): 767–769. doi:10.2307/2261338. JSTOR 2261338.
- ^ Johnson, Steven D.; Steiner, Kim E. (2000). "Generalization versus specialization in plant pollination systems". Trends in Ecology & Evolution. 15 (4): 140–143. doi:10.1016/S0169-5347(99)01811-X. PMID 10717682.
- ^ Waser, Nikolas M.; Chittka, Lars; Price, Mary V.; Williams, Neal M.; Ollerton, Jeff (1996). "Generalization in Pollination Systems, and Why it Matters". Ecology. 77 (4): 1043–1060. doi:10.2307/2265575. JSTOR 2265575.
- ^ Fenster, Charles B.; Armbruster, W. Scott; Wilson, Paul; Dudash, Michele R.; Thomson, James D. (2004). "Pollination Syndromes and Floral Specialization". Annual Review of Ecology, Evolution, and Systematics. 35: 375–403. doi:10.1146/annurev.ecolsys.34.011802.132347.
- ^ Bosch, Jordi; Martín González, Ana M.; Rodrigo, Anselm; Navarro, David (2009). "Plant-pollinator networks: Adding the pollinator's perspective". Ecology Letters. 12 (5): 409–419. doi:10.1111/j.1461-0248.2009.01296.x. PMID 19379135.
- ^ Widmer, A.; Cozzolino, S.; Pellegrino, G.; Soliva, M.; Dafni, A. (2000). "Molecular analysis of orchid pollinaria and pollinaria-remains found on insects". Molecular Ecology. 9 (11): 1911–1914. doi:10.1046/j.1365-294x.2000.01103.x. PMID 11091327. S2CID 13242534.
- ^ Petanidou, T. & Potts, S. G. (2006). "Mutual use of resources in Mediterranean plant–pollinator communities: How specialized are pollination webs?" In: Waser N. M., Ollerton J. (eds) Plant–pollinator interactions, from specialization to generalization, University of Chicago Press, pages 221–244.
- ^ Gómez, José M.; Bosch, Jordi; Perfectti, Francisco; Fernández, Juande; Abdelaziz, Mohamed (2007). "Pollinator diversity affects plant reproduction and recruitment: The tradeoffs of generalization". Oecologia. 153 (3): 597–605. Bibcode:2007Oecol.153..597G. doi:10.1007/s00442-007-0758-3. PMID 17576602. S2CID 4219676.
- ^ Vázquez, Diego P.; Aizen, Marcelo A. (2003). "Null Model Analyses of Specialization in Plant–Pollinator Interactions". Ecology. 84 (9): 2493–2501. doi:10.1890/02-0587. S2CID 54219364.
- ^ a b Dupont, Yoko L.; Trøjelsgaard, Kristian; Hagen, Melanie; Henriksen, Marie V.; Olesen, Jens M.; Pedersen, Nanna M. E.; Kissling, W. Daniel (2014). "Spatial structure of an individual-based plant-pollinator network" (PDF). Oikos. 123 (11): 1301–1310. doi:10.1111/oik.01426. S2CID 31139363.
- ^ a b King, Caroline; Ballantyne, Gavin; Willmer, Pat G. (2013). "Why flower visitation is a poor proxy for pollination: Measuring single-visit pollen deposition, with implications for pollination networks and conservation". Methods in Ecology and Evolution. 4 (9): 811–818. doi:10.1111/2041-210X.12074. hdl:10023/5299.
- ^ a b Lopezaraiza–Mikel, Martha E.; Hayes, Richard B.; Whalley, Martin R.; Memmott, Jane (2007). "The impact of an alien plant on a native plant–pollinator network: An experimental approach". Ecology Letters. 10 (7): 539–550. doi:10.1111/j.1461-0248.2007.01055.x. PMID 17542933.
- ^ a b c d e f Sow, Ahmadou; Haran, Julien; Benoit, Laure; Galan, Maxime; Brévault, Thierry (2020). "DNA Metabarcoding as a Tool for Disentangling Food Webs in Agroecosystems". Insects. 11 (5): 294. doi:10.3390/insects11050294. PMC 7290477. PMID 32403224. Material was copied from this source, which is available under a Creative Commons Attribution 4.0 International License
- ^ Galan, Maxime; Pons, Jean-Baptiste; Tournayre, Orianne; Pierre, Éric; Leuchtmann, Maxime; Pontier, Dominique; Charbonnel, Nathalie (2018). "Metabarcoding for the parallel identification of several hundred predators and their prey: Application to bat species diet analysis". Molecular Ecology Resources. 18 (3): 474–489. doi:10.1111/1755-0998.12749. PMID 29288544. S2CID 1004450.
- ^ a b Paula, Débora P.; Linard, Benjamin; Crampton-Platt, Alex; Srivathsan, Amrita; Timmermans, Martijn J. T. N.; Sujii, Edison R.; Pires, Carmen S. S.; Souza, Lucas M.; Andow, David A.; Vogler, Alfried P. (2016). "Uncovering Trophic Interactions in Arthropod Predators through DNA Shotgun-Sequencing of Gut Contents". PLOS ONE. 11 (9): e0161841. Bibcode:2016PLoSO..1161841P. doi:10.1371/journal.pone.0161841. PMC 5021305. PMID 27622637.
- ^ Pringle, Robert M.; Hutchinson, Matthew C. (2 November 2020). "Resolving Food-Web Structure". Annual Review of Ecology, Evolution, and Systematics. 51 (1): 55–80. doi:10.1146/annurev-ecolsys-110218-024908. ISSN 1543-592X. S2CID 225457667.
- ^ Firlej, Annabelle; Doyon, Josée; Harwood, James D.; Brodeur, Jacques (2013). "A Multi-Approach Study to Delineate Interactions Between Carabid Beetles and Soybean Aphids". Environmental Entomology. 42 (1): 89–96. doi:10.1603/EN11303. PMID 23339789. S2CID 7903342.
- ^ Kartzinel, Tyler R.; Chen, Patricia A.; Coverdale, Tyler C.; Erickson, David L.; Kress, W. John; Kuzmina, Maria L.; Rubenstein, Daniel I.; Wang, Wei; Pringle, Robert M. (2015). "DNA metabarcoding illuminates dietary niche partitioning by African large herbivores". Proceedings of the National Academy of Sciences. 112 (26): 8019–8024. Bibcode:2015PNAS..112.8019K. doi:10.1073/pnas.1503283112. PMC 4491742. PMID 26034267.
- ^ Lopes, C. M.; De Barba, M.; Boyer, F.; Mercier, C.; Da Silva Filho, P J S.; Heidtmann, L. M.; Galiano, D.; Kubiak, B. B.; Langone, P.; Garcias, F. M.; Gielly, L.; Coissac, E.; De Freitas, T R O.; Taberlet, P. (2015). "DNA metabarcoding diet analysis for species with parapatric vs sympatric distribution: A case study on subterranean rodents". Heredity. 114 (5): 525–536. doi:10.1038/hdy.2014.109. PMC 4815513. PMID 25649502. S2CID 5077455.
- ^ Mollot, Gregory; Duyck, Pierre-François; Lefeuvre, Pierre; Lescourret, Françoise; Martin, Jean-François; Piry, Sylvain; Canard, Elsa; Tixier, Philippe (2014). "Cover Cropping Alters the Diet of Arthropods in a Banana Plantation: A Metabarcoding Approach". PLOS ONE. 9 (4): e93740. Bibcode:2014PLoSO...993740M. doi:10.1371/journal.pone.0093740. PMC 3973587. PMID 24695585.
- ^ Greenstone, Matthew H.; Payton, Mark E.; Weber, Donald C.; Simmons, Alvin M. (2014). "The detectability half-life in arthropod predator-prey research: What it is, why we need it, how to measure it, and how to use it". Molecular Ecology. 23 (15): 3799–3813. doi:10.1111/mec.12552. PMID 24303920. S2CID 41032815.
- ^ Symondson, William O. C.; Harwood, James D. (2014). "Special issue on molecular detection of trophic interactions: Unpicking the tangled bank" (PDF). Molecular Ecology. 23 (15): 3601–3604. doi:10.1111/mec.12831. PMID 25051891. S2CID 26082315.
- ^ Valentini, Alice; Pompanon, François; Taberlet, Pierre (2009). "DNA barcoding for ecologists". Trends in Ecology & Evolution. 24 (2): 110–117. doi:10.1016/j.tree.2008.09.011. PMID 19100655.
- ^ Begg, Graham S.; Cook, Samantha M.; Dye, Richard; Ferrante, Marco; Franck, Pierre; Lavigne, Claire; Lövei, Gábor L.; Mansion-Vaquie, Agathe; Pell, Judith K.; Petit, Sandrine; Quesada, Nora; Ricci, Benoit; Wratten, Stephen D.; Birch, A.Nicholas E. (2017). "A functional overview of conservation biological control". Crop Protection. 97: 145–158. doi:10.1016/j.cropro.2016.11.008.
- ^ Gurr, G.M.; Van Emden, H.F.; Wratten, S.D. (1998). "Habitat manipulation and natural enemy efficiency". Conservation Biological Control. pp. 155–183. doi:10.1016/B978-012078147-8/50055-4. ISBN 9780120781478.
- ^ Wyckhuys, Kris A.G.; Lu, Yanhui; Morales, Helda; Vazquez, Luis L.; Legaspi, Jesusa C.; Eliopoulos, Panagiotis A.; Hernandez, Luis M. (2013). "Current status and potential of conservation biological control for agriculture in the developing world". Biological Control. 65: 152–167. doi:10.1016/j.biocontrol.2012.11.010.
- ^ a b Symondson, W. O. C.; Sunderland, K. D.; Greenstone, M. H. (2002). "Can Generalist Predators be Effective Biocontrol Agents?". Annual Review of Entomology. 47: 561–594. doi:10.1146/annurev.ento.47.091201.145240. PMID 11729085.
- ^ Harwood, J. D. and Obrycki, J. J. (2005). "The role of alternative prey in sustaining predator populations". In: M. S. Hoddle (Ed.), Proceedings second international symposium on the biological control of arthropods, volume 2, pages 453–462.
- ^ Harwood, James D.; Desneux, Nicolas; Yoo, HO Jung S.; Rowley, Daniel L.; Greenstone, Matthew H.; Obrycki, John J.; o′Neil, Robert J. (2007). "Tracking the role of alternative prey in soybean aphid predation by Orius insidiosus: A molecular approach". Molecular Ecology. 16 (20): 4390–4400. doi:10.1111/j.1365-294X.2007.03482.x. PMID 17784913. S2CID 21211301.
- ^ a b c Furlong, Michael J. (2015). "Knowing your enemies: Integrating molecular and ecological methods to assess the impact of arthropod predators on crop pests". Insect Science. 22 (1): 6–19. doi:10.1111/1744-7917.12157. PMID 25081301. S2CID 27851198.
- ^ Jonsson, Mattias; Wratten, Steve D.; Landis, Doug A.; Gurr, Geoff M. (2008). "Recent advances in conservation biological control of arthropods by arthropods". Biological Control. 45 (2): 172–175. doi:10.1016/j.biocontrol.2008.01.006.
- ^ Pompanon, Francois; Deagle, Bruce E.; Symondson, William O. C.; Brown, David S.; Jarman, Simon N.; Taberlet, Pierre (2012). "Who is eating what: Diet assessment using next generation sequencing". Molecular Ecology. 21 (8): 1931–1950. doi:10.1111/j.1365-294X.2011.05403.x. PMID 22171763. S2CID 10013333.
- ^ Waldner, Thomas; Traugott, Michael (2012). "DNA‐based analysis of regurgitates: A noninvasive approach to examine the diet of invertebrate consumers". Molecular Ecology Resources. 12 (4): 669–675. doi:10.1111/j.1755-0998.2012.03135.x. PMID 22443278. S2CID 21254959.
- ^ Bohmann, Kristine; Monadjem, Ara; Lehmkuhl Noer, Christina; Rasmussen, Morten; Zeale, Matt R. K.; Clare, Elizabeth; Jones, Gareth; Willerslev, Eske; Gilbert, M. Thomas P. (2011). "Molecular Diet Analysis of Two African Free-Tailed Bats (Molossidae) Using High Throughput Sequencing". PLOS ONE. 6 (6): e21441. Bibcode:2011PLoSO...621441B. doi:10.1371/journal.pone.0021441. PMC 3120876. PMID 21731749.
- ^ a b c d e Pochon, Xavier; Zaiko, Anastasija; Fletcher, Lauren M.; Laroche, Olivier; Wood, Susanna A. (2017). "Wanted dead or alive? Using metabarcoding of environmental DNA and RNA to distinguish living assemblages for biosecurity applications". PLOS ONE. 12 (11): e0187636. Bibcode:2017PLoSO..1287636P. doi:10.1371/journal.pone.0187636. PMC 5667844. PMID 29095959. Material was copied from this source, which is available under a Creative Commons Attribution 4.0 International License
- ^ a b Molnar, Jennifer L.; Gamboa, Rebecca L.; Revenga, Carmen; Spalding, Mark D. (2008). "Assessing the global threat of invasive species to marine biodiversity". Frontiers in Ecology and the Environment. 6 (9): 485–492. doi:10.1890/070064.
- ^ Olenin, Sergej; Minchin, Dan; Daunys, Darius (2007). "Assessment of biopollution in aquatic ecosystems". Marine Pollution Bulletin. 55 (7–9): 379–394. Bibcode:2007MarPB..55..379O. doi:10.1016/j.marpolbul.2007.01.010. PMID 17335857.
- ^ Katsanevakis, Stelios; Wallentinus, Inger; Zenetos, Argyro; Leppäkoski, Erkki; Çinar, Melih Ertan; Oztürk, Bayram; Grabowski, Michal; Golani, Daniel; Cardoso, Ana Cristina (2014). "Impacts of invasive alien marine species on ecosystem services and biodiversity: A pan-European review". Aquatic Invasions. 9 (4): 391–423. doi:10.3391/ai.2014.9.4.01.
- ^ Pimentel, David; Zuniga, Rodolfo; Morrison, Doug (2005). "Update on the environmental and economic costs associated with alien-invasive species in the United States". Ecological Economics. 52 (3): 273–288. doi:10.1016/j.ecolecon.2004.10.002.
- ^ a b Harvey, Chad T.; Qureshi, Samir A.; MacIsaac, Hugh J. (2009). "Detection of a colonizing, aquatic, non-indigenous species". Diversity and Distributions. 15 (3): 429–437. doi:10.1111/j.1472-4642.2008.00550.x. S2CID 53602450.
- ^ Leppäkoski, Erkki; Gollasch, Stephan; Olenin, Sergej (29 June 2013). Invasive Aquatic Species of Europe. Distribution, Impacts and Management. Springer. ISBN 9789401599566.
- ^ Hulme, Philip E. (2009). "Trade, transport and trouble: Managing invasive species pathways in an era of globalization". Journal of Applied Ecology. 46: 10–18. doi:10.1111/j.1365-2664.2008.01600.x.
- ^ Inglis G, Floerl O, Ahyong S, Cox S, Unwin M, Ponder-Sutton A, et al. (2010) "The biosecurity risks associated with biofouling on international vessels arriving in New Zealand: summary of the patterns and predictors of fouling". Biosecurity New Zealand, Technical Report No: 2008.
- ^ Ruiz, Gregory M.; Rawlings, Tonya K.; Dobbs, Fred C.; Drake, Lisa A.; Mullady, Timothy; Huq, Anwarul; Colwell, Rita R. (2000). "Global spread of microorganisms by ships". Nature. 408 (6808): 49–50. Bibcode:2000Natur.408...49R. doi:10.1038/35040695. PMID 11081499. S2CID 205010602.
- ^ Gollasch, S. (2002). "The Importance of Ship Hull Fouling as a Vector of Species Introductions into the North Sea". Biofouling. 18 (2): 105–121. doi:10.1080/08927010290011361. S2CID 85620063.
- ^ Mineur, Frédéric; Johnson, Mark P.; Maggs, Christine A. (2008). "Macroalgal Introductions by Hull Fouling on Recreational Vessels: Seaweeds and Sailors". Environmental Management. 42 (4): 667–676. Bibcode:2008EnMan..42..667M. doi:10.1007/s00267-008-9185-4. PMID 18704562. S2CID 25680517.
- ^ Johnson, Ladd E.; Ricciardi, Anthony; Carlton, James T. (2001). "Overland Dispersal of Aquatic Invasive Species: A Risk Assessment of Transient Recreational Boating". Ecological Applications. 11 (6): 1789. doi:10.1890/1051-0761(2001)011[1789:ODOAIS]2.0.CO;2. ISSN 1051-0761.
- ^ Darbyson, Emily (2009). "Marine boating habits and the potential for spread of invasive species in the Gulf of St. Lawrence". Aquatic Invasions. 4: 87–94. doi:10.3391/ai.2009.4.1.9.
- ^ Acosta, Hernando; Forrest, Barrie M. (2009). "The spread of marine non-indigenous species via recreational boating: A conceptual model for risk assessment based on fault tree analysis". Ecological Modelling. 220 (13–14): 1586–1598. doi:10.1016/j.ecolmodel.2009.03.026.
- ^ McMahon, Robert (2011). "Quagga mussel (Dreissena rostriformis bugensis) population structure during the early invasion of Lakes Mead and Mohave January-March 2007". Aquatic Invasions. 6 (2): 131–140. doi:10.3391/ai.2011.6.2.02.
- ^ a b Fletcher, Lauren M.; Zaiko, Anastasija; Atalah, Javier; Richter, Ingrid; Dufour, Celine M.; Pochon, Xavier; Wood, Susana A.; Hopkins, Grant A. (2017). "Bilge water as a vector for the spread of marine pests: A morphological, metabarcoding and experimental assessment". Biological Invasions. 19 (10): 2851–2867. doi:10.1007/s10530-017-1489-y. S2CID 25513146.
- ^ a b Sinner, Jim, Barrie Forrest, Mark Newton, Graeme Inglis, Chris Woods, Don Morrisey, Aurélie Castinel, and Rowan Strickland (2013) "Managing the domestic spread of harmful marine organisms" Part B: Statutory framework and analysis of options. Cawthron Institute.
- ^ Inglis G, Morrissey D, Woods C, Sinner J, Newton M. (2013) "Managing the Domestic Spread of Harmful Marine Organisms", Part A: Operational Tools for Management. New Zealand Ministry for Primary Industry, Report No. 2013/xx.
- ^ Comtet, Thierry; Sandionigi, Anna; Viard, Frédérique; Casiraghi, Maurizio (2015). "DNA (Meta)barcoding of biological invasions: A powerful tool to elucidate invasion processes and help managing aliens". Biological Invasions. 17 (3): 905–922. doi:10.1007/s10530-015-0854-y. S2CID 12799342.
- ^ Zaiko, Anastasija; Schimanski, Kate; Pochon, Xavier; Hopkins, Grant A.; Goldstien, Sharyn; Floerl, Oliver; Wood, Susanna A. (2016). "Metabarcoding improves detection of eukaryotes from early biofouling communities: Implications for pest monitoring and pathway management". Biofouling. 32 (6): 671–684. doi:10.1080/08927014.2016.1186165. PMID 27212415. S2CID 46842367.
- ^ Brown, Emily A.; Chain, Frédéric J. J.; Zhan, Aibin; MacIsaac, Hugh J.; Cristescu, Melania E. (2016). "Early detection of aquatic invaders using metabarcoding reveals a high number of non-indigenous species in Canadian ports". Diversity and Distributions. 22 (10): 1045–1059. doi:10.1111/ddi.12465.
- ^ Zaiko, Anastasija; Martinez, Jose L.; Schmidt-Petersen, Julia; Ribicic, Deni; Samuiloviene, Aurelija; Garcia-Vazquez, Eva (2015). "Metabarcoding approach for the ballast water surveillance – an advantageous solution or an awkward challenge?". Marine Pollution Bulletin. 92 (1–2): 25–34. Bibcode:2015MarPB..92...25Z. doi:10.1016/j.marpolbul.2015.01.008. PMID 25627196.
- ^ Shokralla, Shadi; Spall, Jennifer L.; Gibson, Joel F.; Hajibabaei, Mehrdad (2012). "Next-generation sequencing technologies for environmental DNA research". Molecular Ecology. 21 (8): 1794–1805. doi:10.1111/j.1365-294X.2012.05538.x. PMID 22486820. S2CID 5944083.
- ^ Ji, Yinqiu; Ashton, Louise; Pedley, Scott M.; Edwards, David P.; Tang, Yong; Nakamura, Akihiro; Kitching, Roger; Dolman, Paul M.; Woodcock, Paul; Edwards, Felicity A.; Larsen, Trond H.; Hsu, Wayne W.; Benedick, Suzan; Hamer, Keith C.; Wilcove, David S.; Bruce, Catharine; Wang, Xiaoyang; Levi, Taal; Lott, Martin; Emerson, Brent C.; Yu, Douglas W. (2013). "Reliable, verifiable and efficient monitoring of biodiversity via metabarcoding". Ecology Letters. 16 (10): 1245–1257. doi:10.1111/ele.12162. hdl:10072/56911. PMID 23910579.
- ^ Darling, John A.; Frederick, Raymond M. (2018). "Nucleic acids-based tools for ballast water surveillance, monitoring, and research". Journal of Sea Research. 133: 43–52. Bibcode:2018JSR...133...43D. doi:10.1016/j.seares.2017.02.005. PMC 6104837. PMID 30147432.
- ^ Corinaldesi, C.; Beolchini, F.; Dell'Anno, A. (2008). "Damage and degradation rates of extracellular DNA in marine sediments: Implications for the preservation of gene sequences". Molecular Ecology. 17 (17): 3939–3951. doi:10.1111/j.1365-294X.2008.03880.x. PMID 18643876. S2CID 22062643.
- ^ Dell'Anno, A.; Danovaro, R. (2005). "Extracellular DNA Plays a Key Role in Deep-Sea Ecosystem Functioning". Science. 309 (5744): 2179. doi:10.1126/science.1117475. PMID 16195451. S2CID 39216262.
- ^ Mengoni, Alessio; Tatti, Enrico; Decorosi, Francesca; Viti, Carlo; Bazzicalupo, Marco; Giovannetti, Luciana (2005). "Comparison of 16S rRNA and 16S rDNA T-RFLP Approaches to Study Bacterial Communities in Soil Microcosms Treated with Chromate as Perturbing Agent". Microbial Ecology. 50 (3): 375–384. doi:10.1007/s00248-004-0222-4. PMID 16254761. S2CID 23943691.
- ^ Pawlowski, Jan; Esling, Philippe; Lejzerowicz, Franck; Cedhagen, Tomas; Wilding, Thomas A. (2014). "Environmental monitoring through protist next-generation sequencing metabarcoding: Assessing the impact of fish farming on benthic foraminifera communities". Molecular Ecology Resources. 14 (6): 1129–1140. doi:10.1111/1755-0998.12261. PMID 24734911. S2CID 2303206.
- ^ Visco, Joana Amorim; Apothéloz-Perret-Gentil, Laure; Cordonier, Arielle; Esling, Philippe; Pillet, Loïc; Pawlowski, Jan (2015). "Environmental Monitoring: Inferring the Diatom Index from Next-Generation Sequencing Data". Environmental Science & Technology. 49 (13): 7597–7605. Bibcode:2015EnST...49.7597V. doi:10.1021/es506158m. PMID 26052741.
- ^ Dowle, Eddy; Pochon, Xavier; Keeley, Nigel; Wood, Susanna A. (2015). "Assessing the effects of salmon farming seabed enrichment using bacterial community diversity and high-throughput sequencing". FEMS Microbiology Ecology. 91 (8): fiv089. doi:10.1093/femsec/fiv089. PMID 26207046.
- ^ Pochon, X.; Wood, S.A.; Keeley, N.B.; Lejzerowicz, F.; Esling, P.; Drew, J.; Pawlowski, J. (2015). "Accurate assessment of the impact of salmon farming on benthic sediment enrichment using foraminiferal metabarcoding". Marine Pollution Bulletin. 100 (1): 370–382. Bibcode:2015MarPB.100..370P. doi:10.1016/j.marpolbul.2015.08.022. PMID 26337228.
- ^ Laroche, Olivier; Wood, Susanna A.; Tremblay, Louis A.; Ellis, Joanne I.; Lejzerowicz, Franck; Pawlowski, Jan; Lear, Gavin; Atalah, Javier; Pochon, Xavier (2016). "First evaluation of foraminiferal metabarcoding for monitoring environmental impact from an offshore oil drilling site". Marine Environmental Research. 120: 225–235. Bibcode:2016MarER.120..225L. doi:10.1016/j.marenvres.2016.08.009. hdl:10754/622291. PMID 27595900.
- ^ Cázarez Carrillo, D. E. Descripción de la larva de ‘‘Eucinostomus jonesii’’ (Pisces, Gerreidae) by morphological and genetic methods.
- ^ Kerr, K. C., Lijtmaer, D. A., Barreira, A. S., Hebert, P. D., & Tubaro, P. L. (2009). Probing evolutionary patterns in Neotropical birds through DNA barcodes. PLOS ONE, 4(2), e4379.
- ^ Lijtmaer, D. A., Kerr, K. C., Barreira, A. S., Hebert, P. D., & Tubaro, P. L. (2011). DNA barcode libraries provide insight into continental patterns of avian diversification. PLOS ONE, 6(7), e20744.
- ^ Lijtmaer, D. A., Kerr, K. C., Stoeckle, M. Y., & Tubaro, P. L. (2012). DNA barcoding birds: from field collection to data analysis. In DNA Barcodes (pp. 127-152). Humana Press.
- ^ García Morales, A. E. (2013). Código de barras y análisis filogeográfico de rotíferos (Monogononta, Ploima) del sureste mexicano.
- ^ de Carvalho, Daniel Cardoso; Cecília Gontijo Leal; Paulo dos Santos Pompeu; José Vanderval Melo Junior & Denise A. A. de Oliveira (2011). Aplicações da técnica de identificação genética - DNA Barcode - nos peixes da bacia do rio São Francisco. Boletim Sociedade Brasileira de Ictiología N°104. Departamento de Morfologia, Instituto de Biociências, Botucatu, São Paulo, Brasil.
- ^ de Carvalho, Daniel Cardoso; Paulo dos Santos Pompeu; Cecília Gontijo Leal; Denise A. A. de Oliveira & Hanner, R. (2011). Deep barcode divergence in Brazilian freshwater fishes: The case of the São Francisco River Basin. Mitochondrial DNA, 2011.
- ^ Hernández, Esmeralda Salgado (2008). El código de barras genético ("DNA barcoding") como herramienta en la identificación de especies. Herreriana. Revista de divulgación de la ciencia. Vol. 4 (1).
- ^ Hebert P. and G. Ryan (2005). The promise of DNA Barcoding for Taxonomy. Systematic Biology. 54(5):852-859.
- ^ Hollingsworth, P. (2007). DNA barcoding: potential users. Genomics, Society and Policy. 3(2):44-47.
- ^ Casey, Fiona; Old, Julie M.; Stannard, Hayley J. (2023). "Assessment of the diet of the critically endangered northern hairy-nosed wombat (Lasiorhinus krefftii) using DNA metabarcoding". Ecology and Evolution. 13. doi:10.1002/ece3.10469. PMC 10485309.
- ^ "What Is DNA Barcoding?". Barcode of Life. Archived from the original on 1 July 2017. Retrieved 11 October 2017.
- ^ Evans, Darren M.; Kitson, James J. N.; Lunt, David H.; Straw, Nigel A.; Pocock, Michael J. O. (2016). "Merging DNA metabarcoding and ecological network analysis to understand and build resilient terrestrial ecosystems" (PDF). Functional Ecology. 30 (12): 1904–1916. doi:10.1111/1365-2435.12659. ISSN 1365-2435.
- ^ DNAqua-Net European Cooperation in Science and Technology. Accessed:9 October 2022.
- ^ Pawlowski, Jan; Kelly-Quinn, Mary; Altermatt, Florian; Apothéloz-Perret-Gentil, Laure; Beja, Pedro; Boggero, Angela; Borja, Angel; Bouchez, Agnès; Cordier, Tristan (2018). "The future of biotic indices in the ecogenomic era: Integrating (e)DNA metabarcoding in biological assessment of aquatic ecosystems". Science of the Total Environment. 637–638: 1295–1310. Bibcode:2018ScTEn.637.1295P. doi:10.1016/j.scitotenv.2018.05.002. hdl:20.500.12327/138. PMID 29801222.
- ^ Ratnasingham, Sujeevan; Hebert, Paul D. N. (2007). "BOLD: The Barcode of Life Data System (http://www.barcodinglife.org)". Molecular Ecology Notes. 7 (3): 355–364. doi:10.1111/j.1471-8286.2007.01678.x. PMC 1890991. PMID 18784790.
- ^ Stoeckle, Mark (November–December 2013). "DNA Barcoding Ready for Breakout". GeneWatch. 26 (5). Archived from the original on 3 April 2014. Retrieved 14 February 2021.
- ^ DeSalle, R.; Egan, M. G.; Siddall, M. (2005). "The unholy trinity: taxonomy, species delimitation and DNA barcoding". Philosophical Transactions of the Royal Society B: Biological Sciences. 360 (1462): 1905–1916. doi:10.1098/rstb.2005.1722. PMC 1609226. PMID 16214748.
- ^ Whitworth, T. L.; Dawson, R. D.; Magalon, H.; Baudry, E. (2007). "DNA barcoding cannot reliably identify species of the blowfly genus Protocalliphora (Diptera: Calliphoridae)". Proceedings of the Royal Society B: Biological Sciences. 274 (1619): 1731–1739. doi:10.1098/rspb.2007.0062. PMC 2493573. PMID 17472911.
- ^ Stackebrandt, E.; Goebel, B. M. (1994). "Taxonomic note: a place for DNA-DNA reassociation and 16S rRNA sequence analysis in the present species definition in bacteriology". Int. J. Syst. Bacteriol. 44 (4): 846–849. doi:10.1099/00207713-44-4-846.
- ^ Stackebrandt, E.; Ebers, J. (2006). "Taxonomic parameters revisited: tarnished gold standards" (PDF). Microbiology Today. 33 (4): 152–155. Archived (PDF) from the original on 25 March 2018.
- ^ Newton, Ian (2003). Speciation and Biogeography of Birds. Academic Press. p. 69. ISBN 978-0-08-092499-1. Archived from the original on 7 February 2018.
- ^ Andersson, Malte (1999). Hybridization and skua phylogeny. Vol. 266. pp. 1579–1585. doi:10.1098/rspb.1999.0818. ISBN 9780080924991. PMC 1690163. Archived from the original on 7 February 2018.
{{cite book}}:|journal=ignored (help) - ^ Keswani, J.; Whitman, W. B. (2001). "Relationship of 16S rRNA sequence similarity to DNA hybridization in prokaryotes". International Journal of Systematic and Evolutionary Microbiology. 51 (2): 667–78. doi:10.1099/00207713-51-2-667. PMID 11321113.
Further references[edit]
- ^ Santoferrara, Luciana; Burki, Fabien; Filker, Sabine; Logares, Ramiro; Dunthorn, Micah; McManus, George B. (2020). "Perspectives from Ten Years of Protist Studies by High‐Throughput Metabarcoding". Journal of Eukaryotic Microbiology. 67 (5): 612–622. doi:10.1111/jeu.12813. hdl:10261/223228. PMID 32498124. S2CID 219331807.