McPherson County, Kansas - Simple English Wikipedia, the free encyclopedia
McPherson County | |
|---|---|
 McPherson County Courthouse (2023) | |
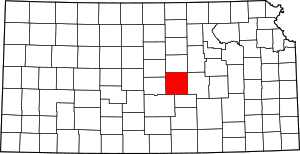
 Location within the U.S. state of Kansas | |
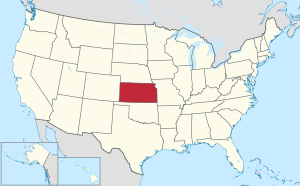
 Kansas's location within the U.S. | |
| Coordinates: 38°24′N 97°42′W / 38.4°N 97.7°W | |
| Country | |
| State | |
| Founded | February 26, 1867 |
| Named for | James B. McPherson |
| Seat | McPherson |
| Largest city | McPherson |
| Area | |
| • Total | 901 sq mi (2,330 km2) |
| • Land | 898 sq mi (2,330 km2) |
| • Water | 2.3 sq mi (6 km2) 0.3% |
| Population | |
| • Total | 30,223 |
| • Density | 33.7/sq mi (13.0/km2) |
| Time zone | UTC−6 (Central) |
| • Summer (DST) | UTC−5 (CDT) |
| Congressional district | 1st |
| Website | mcphersoncountyks.us |
McPherson County (standard abbreviation: MP) is a county in the U.S. state of Kansas. In 2020, 30,223 people lived there.[1] The biggest city is McPherson. It is also the county seat.[2] The county is named after Civil War General James B. McPherson.[3]
Geography[change | change source]
The U.S. Census Bureau says that the county has a total area of 901 square miles (2,330 km2). Of that 898 square miles (2,330 km2) is land and 2.3 square miles (6.0 km2) (0.3%) is water.[4]
Major highways[change | change source]
People[change | change source]
| Historical population | |||
|---|---|---|---|
| Census | Pop. | %± | |
| 1870 | 738 | — | |
| 1880 | 17,143 | 2,222.9% | |
| 1890 | 21,614 | 26.1% | |
| 1900 | 21,421 | −0.9% | |
| 1910 | 21,521 | 0.5% | |
| 1920 | 21,845 | 1.5% | |
| 1930 | 23,588 | 8.0% | |
| 1940 | 24,152 | 2.4% | |
| 1950 | 23,670 | −2.0% | |
| 1960 | 24,285 | 2.6% | |
| 1970 | 24,778 | 2.0% | |
| 1980 | 26,855 | 8.4% | |
| 1990 | 27,268 | 1.5% | |
| 2000 | 29,554 | 8.4% | |
| 2010 | 29,180 | −1.3% | |
| 2020 | 30,223 | 3.6% | |
| U.S. Decennial Census[5] 1790-1960[6] 1900-1990[7] 1990-2000[8] 2010-2020[1] | |||

The McPherson Micropolitan Statistical Area includes all of McPherson County.
Government[change | change source]
Presidential elections[change | change source]
McPherson county is often carried by Republican Candidates. The last time a democratic candidate has carried this county was in 1964 by Lyndon B. Johnson.
Presidential Elections Results
| Year | Republican | Democratic | Third Parties |
|---|---|---|---|
| 2020 | 69.0% 9,964 | 28.6% 4,134 | 2.4% 340 |
| 2016 | 67.1% 8,549 | 25.3% 3,226 | 7.6% 967 |
| 2012 | 69.5% 8,545 | 28.1% 3,449 | 2.5% 303 |
| 2008 | 66.8% 8,937 | 31.5% 4,218 | 1.7% 231 |
| 2004 | 71.8% 9,595 | 26.9% 3,589 | 1.4% 183 |
| 2000 | 68.2% 8,501 | 26.3% 3,272 | 5.5% 688 |
| 1996 | 63.2% 8,142 | 27.5% 3,536 | 9.4% 1,205 |
| 1992 | 44.2% 5,745 | 28.1% 3,645 | 27.7% 3,601 |
| 1988 | 58.8% 6,563 | 39.0% 4,354 | 2.2% 247 |
| 1984 | 71.9% 8,630 | 26.5% 3,185 | 1.6% 189 |
| 1980 | 58.8% 6,843 | 28.7% 3,340 | 12.5% 1,448 |
| 1976 | 57.3% 3,519 | 40.4% 2,483 | 2.3% 138 |
| 1972 | 70.6% 7,457 | 27.0% 2,858 | 2.4% 254 |
| 1968 | 65.0% 6,420 | 29.3% 2,893 | 5.7% 567 |
| 1964 | 45.6% 4,483 | 52.7% 5,173 | 1.7% 170 |
| 1960 | 73.6% 7,920 | 25.8% 2,774 | 0.6% 65 |
| 1956 | 73.8% 7,521 | 25.5% 2,603 | 0.7% 74 |
| 1952 | 74.6% 8,053 | 22.0% 2,371 | 3.5% 374 |
| 1948 | 57.5% 5,952 | 37.5% 3,879 | 5.0% 513 |
| 1944 | 62.3% 5,840 | 35.4% 3,321 | 2.3% 211 |
| 1940 | 60.2% 6,732 | 37.9% 4,240 | 1.8% 204 |
| 1936 | 43.0% 4,744 | 56.6% 6,256 | 0.4% 46 |
| 1932 | 43.7% 4,098 | 53.4% 5,003 | 2.9% 276 |
| 1928 | 80.0% 6,230 | 18.7% 1,457 | 1.3% 102 |
| 1924 | 66.0% 5,128 | 19.7% 1,530 | 14.3% 1,113 |
| 1920 | 69.5% 4,870 | 27.5% 1,926 | 3.0% 211 |
| 1916 | 47.6% 3,806 | 46.8% 3,737 | 5.6% 451 |
| 1912 | 9.8% 455 | 35.3% 1,639 | 54.9% 2,553 |
| 1908 | 57.4% 2,708 | 40.4% 1,905 | 2.3% 106 |
| 1904 | 72.7% 2,991 | 18.8% 773 | 8.5% 349 |
| 1900 | 54.6% 2,640 | 43.9% 2,121 | 1.5% 73 |
| 1896 | 48.9% 2,269 | 50.1% 2,324 | 1.0% 44 |
| 1892 | 48.4% 2,294 | 51.6% 2,444[a] | |
| 1888 | 51.7% 2,279 | 18.8% 829 | 29.5% 1,300 |
Education[change | change source]
Unified school districts[change | change source]
- USD 400, Smoky Valley
- "USD 418, McPherson". Archived from the original on 2010-08-30.
- McPherson, Rural Areas
- USD 419, Canton-Galva
- "USD 423, Moundridge". Archived from the original on 2010-08-30.
{{cite web}}:|archive-date=/|archive-url=timestamp mismatch; 2010-09-22 suggested (help)- Moundridge, Rural Areas
- USD 448, Inman
- Inman, Rural Areas
- District Office In Neighboring County
- USD 411, Goessel
- Rural Areas
- "USD 444, Little River-Windom". Archived from the original on 2010-08-30.
{{cite web}}:|archive-date=/|archive-url=timestamp mismatch; 2004-08-24 suggested (help)- Windom, Rural Areas
Communities[change | change source]

Cities[change | change source]
References[change | change source]
- ↑ 1.0 1.1 1.2 "QuickFacts: McPherson County, Kansas". United States Census Bureau. Retrieved October 1, 2023.
- ↑ "Find a County". National Association of Counties. Retrieved 2011-06-07.
- ↑ Gannett, Henry (1905). The Origin of Certain Place Names in the United States. U.S. Government Printing Office. p. 195.
- ↑ "US Gazetteer files: 2010, 2000, and 1990". United States Census Bureau. 2011-02-12. Retrieved 2011-04-23.
- ↑ "U.S. Decennial Census". United States Census Bureau. Retrieved July 27, 2014.
- ↑ "Historical Census Browser". University of Virginia Library. Archived from the original on August 11, 2012. Retrieved July 27, 2014.
- ↑ "Population of Counties by Decennial Census: 1900 to 1990". United States Census Bureau. Retrieved July 27, 2014.
- ↑ "Census 2000 PHC-T-4. Ranking Tables for Counties: 1990 and 2000" (PDF). United States Census Bureau. Retrieved July 27, 2014.
- ↑ "Dave Leip's Atlas of U.S. Presidential Elections".
- Notes
- ↑ 2,335 votes (49.28 percent) were for Populist James B. Weaver (who was supported by the state’s Democrats) and 109 (2.30 percent) for Prohibition Party candidate John Bidwell.
More reading[change | change source]
- County
- Through the Years: A Pictorial History of McPherson County; McPherson Sentinel' Heritage House Publishing Co; 1992.
- McPherson County First Courthouse Built About 1869 or 1870; Lindsborg News-Record; March 30, 1959.
- Pioneer Life and Lore of McPherson County, Kansas; Edna Nyquist; Democratic-Opinion Press; 1932.
- A History of the Church of the Brethren in Kansas (includes McPherson College history); Elmer LeRoy Craik; McPherson Daily; Republican Press; 397 pages; 1922.
- Portrait and Biographical Record of Dickinson, Saline, McPherson, and Marion Counties, Kansas; Chapman Bros; 614 pages; 1893.
- Standard Atlas of McPherson County, Kansas; Geo. A. Ogle & Co; 82 pages; 1921.
- Plat Book of McPherson County, Kansas; North West Publishing Co; 50 pages; 1903.
- Edwards' Atlas of McPherson County, Kansas; John P. Edwards; 51 pages; 1884.
- Trails
- Almira Sheffield Peckham Cordy (1915). The Story of the Marking of the Santa Fe Trail. Crane. p. 7.
- The National Old Trails Road To Southern California, Part 1 (LA to KC); Automobile Club Of Southern California; 64 pages; 1916. (Download 6.8MB PDF eBook)
- Mennonite Settlements
- Impact of Mennonite settlement on the cultural landscape of Kansas; Brenda Martin; Kansas State University; 1985/1988.
- Mennonite settlement : the relationship between the physical and cultural environment; Susan Movle; University of Utah; 1975/1886.
- Status of Mennonite women in Kansas in their church and home relationships; Eva Harshbarger; Bluffton College; 1925/1945.
Other websites[change | change source]
Wikimedia Commons has media related to McPherson County, Kansas.
- County
- Official website

- "McPherson County - Directory of Public Officials". Archived from the original on 2010-08-30.
{{cite web}}:|archive-date=/|archive-url=timestamp mismatch; 2011-05-05 suggested (help)
- Maps
- McPherson County Maps: Current, Historic, KDOT
- Kansas Highway Maps: Current, Historic, KDOT
- Kansas Railroad Maps: Current, 1996, 1915, KDOT and Kansas Historical Society
38°24′N 97°40′W / 38.400°N 97.667°W


 French
 Deutsch
