
 French
 Deutsch
Ellsworth County, Kansas - Simple English Wikipedia, the free encyclopedia
Ellsworth County | |
|---|---|
 Ellsworth County Courthouse in Ellsworth (2013) | |
 Location within the U.S. state of Kansas | |
 Kansas's location within the U.S. | |
| Coordinates: 38°42′N 98°12′W / 38.700°N 98.200°W | |
| Country | |
| State | |
| Founded | February 26, 1867 |
| Named for | Fort Ellsworth |
| Seat | Ellsworth |
| Largest city | Ellsworth |
| Area | |
| • Total | 723 sq mi (1,870 km2) |
| • Land | 716 sq mi (1,850 km2) |
| • Water | 7.4 sq mi (19 km2) 1.0% |
| Population | |
| • Total | 6,376 |
| • Density | 8.9/sq mi (3.4/km2) |
| Time zone | UTC−6 (Central) |
| • Summer (DST) | UTC−5 (CDT) |
| Area code | 785 |
| Congressional district | 1st |
| Website | ellsworthcounty.org |
Ellsworth County (county code EW) is a county in the U.S. state of Kansas. In 2020, 6,376 people lived there.[1] Its county seat is Ellsworth. Ellsworth is also the biggest city in the county.[2]
Geography[change | change source]
The U.S. Census Bureau says that the county has a total area of 723 square miles (1,870 km2). Of that, 716 square miles (1,850 km2) is land and 7.4 square miles (19 km2) (1.0%) is water.[3] It is intersected by the Smoky Hill River.[4]
Demographics[change | change source]
| Historical population | |||
|---|---|---|---|
| Census | Pop. | %± | |
| 1870 | 1,185 | — | |
| 1880 | 8,494 | 616.8% | |
| 1890 | 9,272 | 9.2% | |
| 1900 | 9,626 | 3.8% | |
| 1910 | 10,444 | 8.5% | |
| 1920 | 10,379 | −0.6% | |
| 1930 | 10,132 | −2.4% | |
| 1940 | 9,855 | −2.7% | |
| 1950 | 8,465 | −14.1% | |
| 1960 | 7,677 | −9.3% | |
| 1970 | 6,146 | −19.9% | |
| 1980 | 6,640 | 8.0% | |
| 1990 | 6,586 | −0.8% | |
| 2000 | 6,525 | −0.9% | |
| 2010 | 6,497 | −0.4% | |
| 2020 | 6,376 | −1.9% | |
| U.S. Decennial Census[5] 1790-1960[6] 1900-1990[7] 1990-2000[8] 2010-2020[1] | |||

Government[change | change source]
Presidential elections[change | change source]
Presidential Elections Results
| Year | Republican | Democratic | Third Parties |
|---|---|---|---|
| 2020 | 75.3% 2,148 | 22.7% 648 | 2.0% 57 |
| 2016 | 72.8% 1,969 | 19.3% 521 | 8.0% 216 |
| 2012 | 71.2% 1,930 | 25.9% 702 | 3.0% 80 |
| 2008 | 68.8% 2,021 | 29.0% 851 | 2.3% 66 |
| 2004 | 72.8% 2,259 | 25.8% 801 | 1.4% 42 |
| 2000 | 65.0% 1,845 | 29.1% 825 | 6.0% 169 |
| 1996 | 64.1% 2,078 | 27.8% 899 | 8.1% 263 |
| 1992 | 37.0% 1,197 | 31.2% 1,010 | 31.9% 1,032 |
| 1988 | 57.0% 1,711 | 40.6% 1,219 | 2.3% 70 |
| 1984 | 71.4% 2,353 | 27.4% 905 | 1.2% 40 |
| 1980 | 65.9% 2,155 | 27.1% 886 | 7.0% 229 |
| 1976 | 49.9% 1,618 | 48.5% 1,573 | 1.7% 55 |
| 1972 | 65.2% 2,087 | 32.1% 1,028 | 2.7% 86 |
| 1968 | 57.5% 1,776 | 34.3% 1,060 | 8.1% 251 |
| 1964 | 39.8% 1,406 | 59.9% 2,118 | 0.4% 13 |
| 1960 | 59.4% 2,189 | 40.4% 1,488 | 0.3% 10 |
| 1956 | 64.9% 2,524 | 34.7% 1,351 | 0.4% 14 |
| 1952 | 74.7% 3,219 | 24.8% 1,068 | 0.6% 24 |
| 1948 | 52.8% 2,155 | 46.1% 1,879 | 1.1% 45 |
| 1944 | 57.6% 2,290 | 42.2% 1,678 | 0.2% 6 |
| 1940 | 54.1% 2,658 | 45.6% 2,237 | 0.3% 15 |
| 1936 | 40.7% 2,058 | 59.2% 2,990 | 0.1% 7 |
| 1932 | 35.0% 1,607 | 63.7% 2,928 | 1.4% 63 |
| 1928 | 60.2% 2,450 | 39.0% 1,588 | 0.7% 30 |
| 1924 | 58.8% 2,286 | 24.4% 950 | 16.8% 654 |
| 1920 | 65.6% 2,264 | 31.6% 1,090 | 2.8% 97 |
| 1916 | 48.3% 1,945 | 48.1% 1,936 | 3.6% 143 |
| 1912 | 15.3% 353 | 45.4% 1,045 | 39.3% 905 |
| 1908 | 53.0% 1,213 | 45.4% 1,039 | 1.7% 39 |
| 1904 | 68.4% 1,359 | 29.1% 578 | 2.5% 49 |
| 1900 | 56.7% 1,333 | 42.8% 1,006 | 0.6% 13 |
| 1896 | 50.9% 1,048 | 48.2% 992 | 0.9% 18 |
| 1892 | 49.8% 1,102 | 50.2% 1,111[a] | |
| 1888 | 56.5% 1,159 | 40.5% 831 | 3.0% 61 |
Education[change | change source]
Unified school districts[change | change source]
Communities[change | change source]

Cities[change | change source]
References[change | change source]
- ↑ 1.0 1.1 1.2 "QuickFacts: Ellsworth County, Kansas". United States Census Bureau. Retrieved October 1, 2023.
- ↑ "Find a County". National Association of Counties. Archived from the original on 2011-05-31. Retrieved 2011-06-07.
- ↑ "US Gazetteer files: 2010, 2000, and 1990". United States Census Bureau. 2011-02-12. Retrieved 2011-04-23.
- ↑ Ripley, George; Dana, Charles A., eds. (1879). . The American Cyclopædia.
- ↑ "U.S. Decennial Census". United States Census Bureau. Archived from the original on April 26, 2015. Retrieved July 24, 2014.
- ↑ "Historical Census Browser". University of Virginia Library. Archived from the original on August 11, 2012. Retrieved July 24, 2014.
- ↑ "Population of Counties by Decennial Census: 1900 to 1990". United States Census Bureau. Retrieved July 24, 2014.
- ↑ "Census 2000 PHC-T-4. Ranking Tables for Counties: 1990 and 2000" (PDF). United States Census Bureau. Retrieved July 24, 2014.
- ↑ "Dave Leip's Atlas of U.S. Presidential Elections".
- Notes
- ↑ This total comprises 1,097 votes (49.6%) were for Populist James B. Weaver (who was supported by the state’s Democrats) and 14 (0.6%) for Prohibition Party candidate John Bidwell.
More reading[change | change source]
- Standard Atlas of Ellsworth County, Kansas; Geo. A. Ogle & Co; 70 pages; 1918.
- Plat Book of Ellsworth County, Kansas; North West Publishing Co; 41 pages; 1901.
Other websites[change | change source]
Wikimedia Commons has media related to Ellsworth County, Kansas.
- County
- Other
- Ellsworth County Independent Reporter (local newspaper)
- Kansas Post Offices, 1828-1961 (Ellsworth County)
- Maps
- Ellsworth County Maps: Current, Historic, KDOT
- Kansas Highway Maps: Current, Historic, KDOT
- Kansas Railroad Maps: Current, 1996, 1915, KDOT and Kansas Historical Society
Municipalities and communities of Ellsworth County, Kansas, United States | ||
|---|---|---|
| Cities | 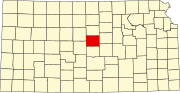 | |
| Unincorporated communities | ||
| Ghost towns | ||
| Townships | ||
| Point of interest | ||

| International | |
|---|---|
| National | |
| Other | |