Файл:Partial transmittance.gif — Википедия

Partial_transmittance.gif(367 × 161 пкс, размер файла: 67 Кб, MIME-тип: image/gif, закольцованный, 53 фрейма, 4,2 с)

Краткое описание

Описание
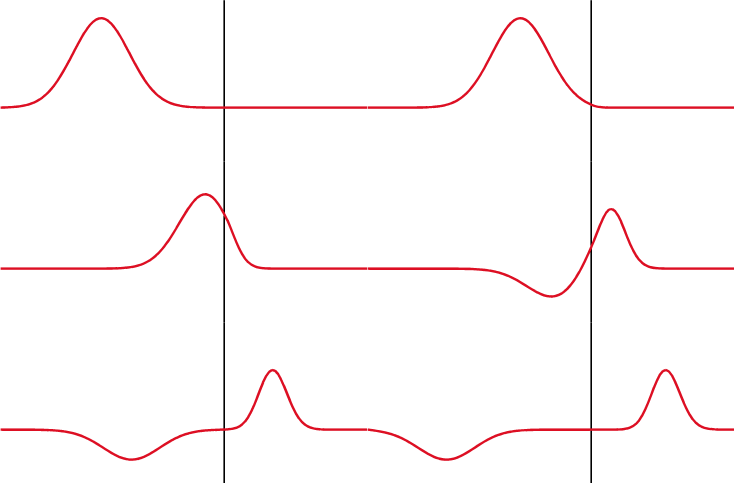
Русский: Показано классическое отражение/прохождение солитона гауссового импульса от/в более плотную среду. В реальности же, свет отражается не от поверхности, а от всех частиц тела (см. ru:КЭД).
English: Illustration of partial reflection of a wave. A gaussian wave on a one-dimensional string strikes a boundary with transmission coefficient of 0.5. Half the wave is transmitted and half is reflected.
Français : Illustration de la réflection partielle d'une onde. Une onde gaussienne se déplaçant sur un ressort unidimensionnel est réfléchie/transmise au niveau d'une interface avec un coefficient de transmission de 0.5.
Español: Ilustración de una reflexión parcial de una onda. Una onda gaussiana sobre una cuerda de una dimensión choca contra un limite con un coeficiente de transmisión de 0.5. La mitad de la onda es transmitida y la otra mitad es reflejada.
Дата
Источник self-made with MATLAB, source code below
Автор Oleg Alexandrov
 
Это diagram было создано с помощью MATLAB.

Лицензирование

Public domain Я, владелец авторских прав на это произведение, передаю его в общественное достояние. Это разрешение действует по всему миру.
В некоторых странах это не может быть возможно юридически, в таком случае:
Я даю право кому угодно использовать данное произведение в любых целях без каких-либо условий, за исключением таких условий, которые требуются по закону.

MATLAB source code

% Partial transmittance and reflectance of a wave % Code is messed up, don't have time to clean it now function main()      % KSmrq's colors    red    = [0.867 0.06 0.14];    blue   = [0, 129, 205]/256;    green  = [0, 200,  70]/256;    yellow = [254, 194,   0]/256;    white = 0.99*[1, 1, 1];    black = [0, 0, 0];      % length of the string and the grid    L = 5;    N = 151;    X=linspace(0, L, N);      h = X(2)-X(1); % space grid size    c = 0.01; % speed of the wave    tau = 0.25*h/c; % time grid size      % form a medium with a discontinuous wave speed    C = 0*X+c;      D=L/2;    c_right = 0.5*c; % speed to the right of the disc    for i=1:N       if X(i) > D          C(i) = c_right;       end    end    % Now C = c for x < D, and C=c_right for x > D      K = 5; % steepness of the bump    S = 0; % shift the wave    f=inline('exp(-K*(x-S).^2)', 'x', 'S', 'K'); % a gaussian as an initial wave    df=inline('-2*K*(x-S).*exp(-K*(x-S).^2)', 'x', 'S', 'K'); % derivative of f      % wave at time 0 and tau    U0 = 0*f(X, S, K);    U1 = U0 - 2*tau*c*df(X, S, K);      U = 0*U0; % current U      % plot between Start and End    Start=130; End=500;      % hack to capture the first period of the wave    min_k = 2*N; k_old = min_k; turn_on = 0;       frame_no = 0;    for j=1:End         %  fixed end points       U(1)=0; U(N)=0;         % finite difference discretization in time       for i=2:(N-1)          U(i) = (C(i)*tau/h)^2*(U1(i+1)-2*U1(i)+U1(i-1)) + 2*U1(i) - U0(i);       end         % update info, for the next iteration       U0 = U1; U1 = U;         spacing=7;        % plot the wave       if rem(j, spacing) == 1 & j > Start            figure(1); clf; hold on;          axis equal; axis off;           lw = 3; % linewidth            % size of the window          ys = 1.2;            low = -0.5*ys;          high = ys;          plot([D, D], [low, high], 'color', black, 'linewidth', 0.7*lw) %         fill([X(1), D, D, X(1)], [low, low, high, high], [0.9, 1, 1], 'edgealpha', 0); %         fill([D X(N), X(N), D],  [low, low, high, high], [1, 1, 1], 'edgealpha', 0);            plot(X, U, 'color', red, 'linewidth', lw);            % plot the ends of the string          small_rad = 0.06;            axis([-small_rad, 0.82*L, -ys, ys]);            % small markers to keep the bounding box fixed when saving to eps          plot(-small_rad, ys, '*', 'color', white);          plot(L+small_rad, -ys, '*', 'color', white);            pause(0.1)          frame_no = frame_no + 1;          %frame=sprintf('Frame%d.eps', 1000+frame_no); saveas(gcf, frame, 'psc2');          frame=sprintf('Frame%d.png', 1000+frame_no);% saveas(gcf, frame);          disp(frame)          print (frame, '-dpng', '-r300');         end    end     % The gif image was creating with the command % convert -antialias -loop 10000  -delay 8 -compress LZW -scale 20% Frame10*png Partial_transmittance.gif % and was later cropped in Gimp 

Краткие подписи

Добавьте однострочное описание того, что собой представляет этот файл

Элементы, изображённые на этом файле

изображённый объект

У этого свойства есть некоторое значение без элемента в

История файла

Нажмите на дату/время, чтобы посмотреть файл, который был загружен в тот момент.

Дата/времяМиниатюраРазмерыУчастникПримечание
текущий16:36, 9 апреля 2010Миниатюра для версии от 16:36, 9 апреля 2010367 × 161 (67 Кб)Aiyizooptimized animation
05:56, 26 ноября 2007Миниатюра для версии от 05:56, 26 ноября 2007367 × 161 (86 Кб)Oleg Alexandrov{{Information |Description=Illustration of en:Transmission coefficient (optics) |Source=self-made with MATLAB, source code below |Date=~~~~~ |Author= Oleg Alexandrov |Permission=PD-self, see below |other_versions= }} {{PD-se

Глобальное использование файла

Данный файл используется в следующих вики:

Просмотреть глобальное использование этого файла.