
 French
 Deutsch
ファイル:Pi 30K.gif
高解像度版はありません。
Pi_30K.gif (500 × 500 ピクセル、ファイルサイズ: 476キロバイト、MIME タイプ: image/gif、ループします、10 フレーム、2.0秒)
ウィキメディア・コモンズのファイルページにある説明を、以下に表示します。 |
概要
この GIF ラスター画像はMatplotlibで作成されました。
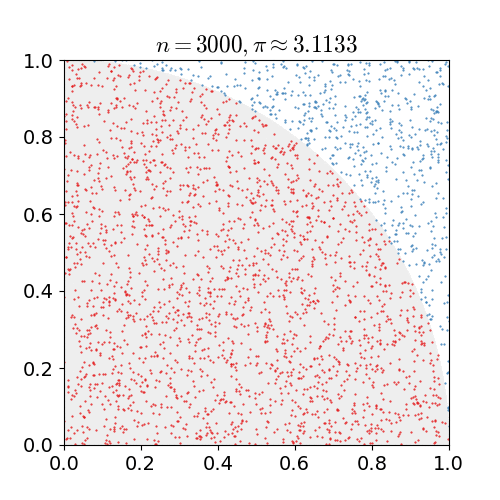
| 解説 | English: As points are randomly scattered inside the unit square, some fall within the unit circle. The fraction of points inside the circle over all points approaches pi/4 as the number of points goes toward infinity. This animation represents this method of computing pi out to 30,000 iterations. |
| 原典 | 投稿者自身による著作物 |
| 作者 | nicoguaro |
| ソースコード | Python codefrom __future__ import division import numpy as np import matplotlib.pyplot as plt import matplotlib.patches as mpatches import matplotlib.animation as animation from matplotlib import rcParams # In Windows the next line should provide the full path to convert.exe # since convert is a Windows command #rcParams['animation.convert_path'] = "C:\Program Files\ImageMagick-6.9.3\convert.exe" rcParams['mathtext.fontset'] = 'cm' rcParams['font.size'] = 14 red = "#e41a1c" blue = "#377eb8" gray = "#eeeeee" def update(n): ax.cla() pts = np.random.uniform(low=0, high=1, size=(2, n)) circ = pts[:, pts[0, :]**2 + pts[1, :]**2 <= 1] out_circ = pts[:, pts[0, :]**2 + pts[1, :]**2 > 1] pi_approx = 4*circ.shape[1]/n circle = mpatches.Wedge((0, 0), 1, 0, 90, color=gray) ax.add_artist(circle) plt.plot(circ[0, :], circ[1, :], marker='.', markersize=1, linewidth=0, color=red) plt.plot(out_circ[0, :], out_circ[1, :], marker='.',markersize=1, linewidth=0, color=blue) plt.title(r"$n = {}, \pi \approx {:.4f}$".format(n, pi_approx)) plt.axis("square") plt.xlim(0, 1) plt.ylim(0, 1) nvec = np.round(np.logspace(2, 5, 10)) nvec = [3000, 4000, 5000, 6500, 8500, 10000, 15000, 18000, 24000, 30000] fig = plt.figure(figsize=(5, 5)) ax = fig.add_subplot(111) ani = animation.FuncAnimation(fig, update, frames=nvec, blit=False) ani.save("monte_carlo_pi.gif", writer='imagemagick', savefig_kwargs={'delay': 6}) |
ライセンス
この作品の著作権者である私は、この作品を以下のライセンスで提供します。
このファイルはクリエイティブ・コモンズ 表示 3.0 非移植ライセンスのもとに利用を許諾されています。
- あなたは以下の条件に従う場合に限り、自由に
- 共有 – 本作品を複製、頒布、展示、実演できます。
- 再構成 – 二次的著作物を作成できます。
- あなたの従うべき条件は以下の通りです。
- 表示 – あなたは適切なクレジットを表示し、ライセンスへのリンクを提供し、変更があったらその旨を示さなければなりません。これらは合理的であればどのような方法で行っても構いませんが、許諾者があなたやあなたの利用行為を支持していると示唆するような方法は除きます。
ファイルの履歴
過去の版のファイルを表示するには、その版の日時をクリックしてください。
| 日付と時刻 | サムネイル | 寸法 | 利用者 | コメント | |
|---|---|---|---|---|---|
| 現在の版 | 2017年2月16日 (木) 16:00 | | 500 × 500 (476キロバイト) | Nicoguaro | Make the plot square and increase gif delay. |
| 2017年2月16日 (木) 15:38 |  | 640 × 480 (476キロバイト) | Nicoguaro | Bigger text in the axes, and colors from ColorBrewer. Code in Python. | |
| 2011年11月7日 (月) 18:29 |  | 500 × 500 (373キロバイト) | Rayhem | Slowed animation to avoid looking like a blinky page element, improved resolution, added counter for number of points, shaded points inside/outside the circle. ==Mathematica 7.0 Source== <pre> tinyColor[color_, point_] := {PointSize[Small], color, Point[ | |
| 2011年3月14日 (月) 23:12 |  | 360 × 369 (363キロバイト) | CaitlinJo | {{Information |Description ={{en|1=As points are randomly scattered inside the unit square, some fall within the unit circle. The fraction of points inside the circle over all points approaches pi as the number of points goes toward infinity. This ani |
ファイルの使用状況
以下のページがこのファイルを使用しています:
グローバルなファイル使用状況
以下に挙げる他のウィキがこの画像を使っています:
- ar.wikipedia.org での使用状況
- be.wikipedia.org での使用状況
- bg.wikipedia.org での使用状況
- ca.wikipedia.org での使用状況
- da.wikipedia.org での使用状況
- el.wikipedia.org での使用状況
- en.wikipedia.org での使用状況
- en.wikibooks.org での使用状況
- eo.wikipedia.org での使用状況
- eu.wikipedia.org での使用状況
- fa.wikipedia.org での使用状況
- fr.wikipedia.org での使用状況
- he.wikipedia.org での使用状況
- hi.wikipedia.org での使用状況
- id.wikipedia.org での使用状況
- it.wikipedia.org での使用状況
- ko.wikipedia.org での使用状況
- pt.wikipedia.org での使用状況
- sh.wikipedia.org での使用状況
- simple.wikipedia.org での使用状況
- sl.wikipedia.org での使用状況
- sr.wikipedia.org での使用状況
- sv.wikipedia.org での使用状況
- ta.wikipedia.org での使用状況
- test.wikipedia.org での使用状況
- tr.wikipedia.org での使用状況
- uk.wikipedia.org での使用状況
- vi.wikipedia.org での使用状況
- www.wikidata.org での使用状況
- zh-yue.wikipedia.org での使用状況
- zh.wikipedia.org での使用状況