
 French
 Deutsch
رتبهبندیهای بینالمللی ایران - ویکیپدیا، دانشنامهٔ آزاد
این مقاله دقیق، کامل و صحیح ترجمه نشده و نیازمند ترجمه به فارسی است. کل یا بخشی از این مقاله به زبانی بهجز زبان فارسی نوشته شدهاست. اگر مقصود ارائهٔ مقاله برای مخاطبان آن زبان است، باید در نسخهای از ویکیپدیا به همان زبان نوشته شود (فهرست ویکیپدیاها را ببینید). در غیر این صورت، خواهشمند است ترجمهٔ این مقاله را با توجه به متن اصلی و با رعایت سیاست ویرایش، دستور خط فارسی و برابر سازی به زبان فارسی بهبود دهید و سپس این الگو را از بالای صفحه بردارید. همچنین برای بحثهای مرتبط، مدخل این مقاله در فهرست صفحههای نیازمند ترجمه به فارسی را ببینید. اگر این مقاله به زبان فارسی بازنویسی نشود، تا دو هفتهٔ دیگر نامزد حذف میشود و/یا به نسخهٔ زبانی مرتبط ویکیپدیا منتقل خواهد شد. اگر شما اخیراً این مقاله را بهعنوان صفحهٔ نیازمند ترجمه برچسب زدهاید، لطفاً عبارت {{جا:هبک-ترجمه به فارسی|1=رتبهبندیهای بینالمللی ایران}} ~~~~را نیز در صفحهٔ بحث نگارنده قرار دهید. |
این مقاله نیازمند بهروزرسانی است. |
کشاورزی[ویرایش]
| نام | رتبه | از بین | منبع | توضیحات | سال | |
|---|---|---|---|---|---|---|
| رتبه بینالمللی ایران در تولید محصولات کشاورزی | ۱ | ۱۴۹ | سازمان ملل | بر اساس میزان صادرات محصولات کشاورزی ایران بین سالهای ۱۹۹۶ تا ۹۸ که رتبه صادرات آن ۱۰۰ از ۱۴۸ کشور است. | ۲۰۰۷ | |
| تعداد ماشینهای کشاورزی : تراکتور | ۲۲ | ۱۹۰ | بانک جهانی | ۲۵۸٬۰۰۰ تراکتور در حال فعالیت | ۲۰۰۳ | |
| سرانه آبیاری زمین | ۱۴ | ۱۷۳ | اطلاعاتنامه جهان | حدود ۱٬۱۵۳ متر مربع برای هر ۱ میلیون نفر | ۲۰۰۳ | |
| فهرست کشورها بر پایه مساحت آبیاری | ۵ | جهان | اطلاعاتنامه جهان | ۷۶٬۵۰۰ کیلومتر مربع تحت آبیاری | ۲۰۰۳ | |
| کل زمینهای کشاورزی | ۱۵ | ۱۹۹ | بانک جهانی | ۶۱۶٬۰۰۰ کیلومتر مربع زمین ویژه کشاورزی | ۲۰۰۵ | |
| سرانه کل زمینهای کشاورزی | ۵۷ | ۱۹۹ | بانک جهانی | حدود ۱۰۰۰ کیلومتر مربع برای هر ۱۰۰۰ نفر | ۲۰۰۵ | |
| مساحت محصولات کشاورزی دائمی | ۱۸ | ۱۸۱ | فائو | دو میلیون و دو هزار هکتار مساحت کشاورزی دائمی میباشد. به ازای هر هزار نفر حدود ۲۹٫۵ (۲۹٬۴۳۳۴ هکتار) مساحت برای کاشت دائمی محصولات کشاورزی وجود دارد؛ که از این لحاظ ایران رتبه ۶۹ از ۱۸۱ کشور را دارد. | ۲۰۰۰ 2 69/181[۱]) | ۲۰۰۰ |
| درصد مساحت زمینهای زراعی از محصولات کل زمین | ۱۰۹ | ۱۹۹ | بانک جهانی | ۹٫۸۴٪ از ۱۶٬۱۰۰٬۰۰۰ هکتار زمین ویژهٔ کشاورزی[۲]) | ۲۰۰۵ | |
| منطقه دایمی گندم زار به درصد از مساحت کل زمین | ۱۱۰ | ۱۸۷ | بانک جهانی | ۰٫۹۲٪ از ماسه زمین کشور به عنوان زراعی دائمی استفاده میشود | ۲۰۰۵ | |
| برداشت ماهی در کشور | ۳۵ | جهان | سازمان ملل متحد | ۵۲۷٬۹۱۲ تن ماهی در سال تولید شده؛ ۴۱۰٬۵۵۸ تن صید و ۱۱۷٬۳۵۴ تن برداشت آبزیپروری | ۲۰۰۵ | |
| فهرست تولید محصولات کشاورزی | ۱۳ | ۱۴۹ | سازمان ملل متحد | شاخص بر اساس خروجی کشاورزی برای سالهای ۱۹۸۹–۹۱ به عنوان ۱۰۰؛ فهرست ایران: ۱۴۱ | ۱۹۹۶–۹۸ | |
| مصرف سالانه دیزل در کشاورزی | ۷ | ۱۰۷ | سازمان ملل متحد | مصرف سالانه گازوئیل در کشاورزی ۳٫۳۴۱٫۰۰۰ تن | ۲۰۰۵ | |
| سرانه مصرف برق کشاورزی | ۱۸ | ۱۱۰ | سازمان ملل متحد | سالیانه ۲۴۱٫۳ کیلو وات ساعت | ۲۰۰۵ | |
| تولید غلات | ۱۳ | ۱۴۹ | سازمان منابع جهانی | سالیانه ۱۴۱٬۰۰۰ تن غلات تولید میشود | ۲۰۰۱ | |
| سرانه تولید گوشت | ۷۳ | ۱۴۹ | سازمان ملل متحد | سالیانه حدود ۲۱٫۱ کیلوگرم برای هر نفر | ۱۹۹۸ |
ارتباطات[ویرایش]
| عنوان | رتبه | از بین | منبع | توضیحات | سال |
|---|---|---|---|---|---|
| آمادگی الکترونیکی | ۶۸ | ۷۰ | Economist Intelligence Unit | Survey was done indirectly &/or by estimation | ۲۰۰۹ |
| فهرست کشورها بر پایه شمار کاربران اینترنت | ۱۱ | ۱۹۵ | وضعیت اینترنت جهان | 51.7% of population use internet; More info: Growth of internet & Computer skills | ۲۰۰۹ |
| فهرست کشورها بر پایه شمار کاربران اینترنت پرسرعت | ۴۴ | ۴۸ | اتحادیه بینالمللی مخابرات راه دور | ۳۰۰٬۰۰۰ اینترنت پرسرعت or ~0.41% of population; More info: اینترنت در ایران | ۲۰۰۸ |
| شاخص فرصتهای دیجیتال بر پایه کشور | ۱۰۵ | ۱۲۰ | اتحادیه بینالمللی مخابرات | Survey was done indirectly &/or by estimation | ۲۰۰۷ |
| فهرست کشورها بر اساس تعداد خطوط تلفن در حال استفاده | ۱۲ | ۱۰۰ | اطلاعاتنامه جهان | ۲۴٬۸۰۰٬۰۰۰ تلفن lines in use; 80% of telephony system had become دیجیتایزر by 2004[۳] | ۲۰۰۸ |
| فهرست کشورها بر پایه تعداد استفاده از گوشیهای تلفن همراه | ۲۰ | ۵۶ | سازمان ملل متحد | ۵۲٬۰۰۰٬۰۰۰ تلفن همراه کاربران؛ ۶۹٫۳٪ از جمعیت از تلفن همراه استفاده میکنند. | ۲۰۱۰ |
| سرمایهگذاری در زیرساختهای مخابراتی به درصد کل درآمد | ۱۰ | ۱۹۰ | بانک جهانی | 73.68% of total revenue in telecommunication sector was reinvested for expansion of مخابرات & Cyberinfrastructure | ۲۰۰۵ |
| آمادگی دولت الکترونیکی | ۱۰۲ | ۱۹۳ | سازمان ملل متحد | Measure of a country's دولت الکترونیک capabilities | ۲۰۱۰ |
| مشارکت الکترونیکی عمومی | ۱۱۷ | ۱۹۳ | سازمان ملل متحد | Measure of a nation's population participation in دولت الکترونیک | ۲۰۱۰ |
| تعداد روزنامهها و نشریات روزانه | ۱۴ | ۱۲۴ | سازمان ملل متحد | 112 daily newspapers & periodicals present | ۲۰۰۰ |
| تعداد روزنامهها و نشریات غیر روزانه | ۸ | ۹۱ | سازمان ملل متحد | 906 non-daily newspapers & periodicals present | ۲۰۰۰ |
| فهرست کشورها بر پایه تعداد ایستگاههای پخش تلویزیون | ۶۷ | ۲۲۸ | اطلاعاتنامه جهان | In 1997 there were 28 TV broadcast stations plus 450 repeaters in Iran; More info: By 2010, there were 74 high power broadcast stations, 430 medium power and 5,000 low power broadcast stations in addition to 120 TV studios, 47 کانال تلویزیونی & ۵۰ رادیو; Iran switched from سکام to پال in 1998; By 2015 Iran plans to complete its switchover to digital TV;[۴] More info: Countries by color TV introduction & Countries by TV introduction | ۱۹۹۷ |
| تعداد ارائه دهندگان سرویس اینترنتی(ISP) | ۹ | ۱۶۵ | اطلاعاتنامه جهان | ۱۰۰ شرکت خدمات اینترنتی's in operation | ۲۰۰۲ |
| فهرست کشورها بر پایه تعداد هاستهای اینترنت | ۱۲۰ | ۱۹۰ | اطلاعاتنامه جهان | There are 2,860 میزبان (شبکه)s in Iran; More info: فهرست دامنههای سطحبالا & Number of servers by company | ۲۰۰۸ |
| تعداد وبسایتها در دامنه ملی | ۵۸ | جهان | وبسنجی | Iran has 310,000 websites on its national domain (dotIR); Iran رتبهs 32nd globally in terms of total number of وبگاه[۵] | ۲۰۰۹ |
| تعداد ارائه دهندگان پست الکترونیکی رایگان بر اساس کشور | ۵۶ | ۸۶ | فهرست بینالمللی ارائه دهندگان پست الکترونیکی رایگان خارج از ایالات متحده آمریکا | There are 4 free webmail providers in Iran; More info: Comparison of e-mail clients | ۲۰۰۸ |
| سرعت اینترنت | ۱۷۴ | ۱۸۱ | نتایندکس | همدان is the استانهای ایران with the fastest upload/download speed at 0.32/1.09 Mbps and I.P.M. is the fastest شرکت خدمات اینترنتی in Iran with 0.76/2.87. | ۲۰۱۰ |
| گزارش شفافیت گوگل | جهان | گوگل | Iran was not among the countries which request censorship by Google; More info: Google traffic by country | ۲۰۱۰ |
جمعیتشناسی[ویرایش]
| عنوان | رتبه | از بین | منبع | توضیحات | سال |
|---|---|---|---|---|---|
| فهرست کشورها بر پایه میزان تولد | ۹۶ | ۱۱۹۶ | سازمان ملل متحد | 20.3 Births per 1000 population/سال | ۲۰۰۵–۱۰ |
| فهرست کشورها بر پایه نرخ مرگ و میر | ۱۸۳ | ۱۹۵ | سازمان ملل متحد | 5.4 Deaths per 1000 population/سال؛ Top ten causes of death in Iran: ۱. بیماریهای ایسکمیک قلب، ۲. تصادف رانندگی، ۳. سکته مغزی، 4. Perinatal conditions, ۵. زیادی فشار خون، ۶. سرطان معده، ۷. بیماری مزمن انسدادی ریه، ۸. اسهال، ۹. بیماری قلبی-عروقی، 10. Lower respiratory tract infection[۶][۷][۸] More info: علت مرض | ۲۰۰۵–۱۰ |
| آمارنگاری طلاق | ۲۵ | جهان | سازمان ملل متحد | Crude divorce rate of 0.94 per 1,000 population; By 2009 Iran's divorce rate had reached 1.7 per 1,000 people[۹] | ۲۰۰۴ |
| فهرست شهرهای جهان بر پایه جمعیت | ۱۷ | ۶۱ | سازمان ملل متحد | City proper of Tehran; population: 7,873,000; Area: 760 km2; Population density: 10,359 Persons/km2 | ۲۰۰۷ |
| جمعیت مناطق شهری | ۳۳ | ۱۸۸ | سازمان ملل متحد | تهران at 33rd and مشهد at 135th | ۲۰۰۷ |
| Urban agglomerations by Population | ۲۸ | ۱۰۰ | سازمان ملل متحد | تهران population agglomerate with a population of 7,873,000 | ۲۰۰۷ |
| فهرست کشورها بر پایه شهرنشینی | ۶۵ | ۱۹۳ | اطلاعاتنامه جهان | 68% of population is urban; 982 cities & 68,122 villages[۱۰] | ۲۰۰۵–۱۰ |
| فهرست کشورها بر پایه شهرنشینی | ۸۲ | ۱۹۳ | اطلاعاتنامه جهان | Urbanization rate of 2.1% | ۲۰۰۵–۱۰ |
| List of countries by infant mortality rate | ۱۱۹ | ۱۹۵ | سازمان ملل متحد | مرگومیر نوزادان of 30.6 & Under-5 mortality rate of 35.5 /1000 live births | ۲۰۰۶ |
| نرخ مرگ و میر مادران | ۹۲ | ۱۳۶ | سازمان ملل متحد | 37/100,000 Pregnancies; By 2008 Iran's MMR became 27.8/100,000 Pregnancies[۱۱] | ۱۹۸۵–۹۹ |
| فهرست کشورها بر پایه جمعیت | ۱۷ | ۲۲۳ | سازمان ملل متحد | Population of 74,196,000 or Approximately 1.09% of the جهان's population; More info: List of countries by population (graphical) & Past and future population by country | ۲۰۰۹ |
| فهرست کشورها بر پایه امید به زندگی | ۱۰۸ | جهان | سازمان ملل متحد | Overall life expectancy of 71 سالs; Male: 69.4yrs; Female: 72.6yrs | ۲۰۰۵–۱۰ |
| فهرست کشورهای جهان بر پایه نسبت جنسی جمعیت | — | — | اطلاعاتنامه جهان | Male/Female; Total: 1.02; At birth: 1.05; Under-15yrs old: 1.05; 15-30yrs old; 1.02; Over-65yrs old: 0.92 | ۲۰۰۹ |
| فهرست کشورها بر پایه نرخ رشد جمعیت | ۹۶ | ۲۳۰ | سازمان ملل متحد | Population growth rate of 1.35% | ۲۰۰۵–۱۰ |
| فهرست کشورها بر پایه تراکم جمعیت | ۱۶۰ | ۲۳۹ | سازمان ملل متحد | Population density of 45.017 persons/km2 | ۲۰۰۵ |
| فهرست کشورها بر پایه مهاجرت | ۱۲۶ | ۱۵۴ | اطلاعاتنامه جهان | Migrants/1000 population: -2.62 | ۲۰۰۹ |
| Fertility Rate | ۱۲۹ | ۲۲۳ | سازمان ملل متحد | نرخ کلی زاد و ولد of 2.04 births/woman; Iran has reduced its fertility rate of 6.6 births/woman in 1970 to the replacement level of 2 in 2005 in a revolutionary female health program & successfully stopping Iran's first baby-boom; This reduction of fertility rate is one of the fastest in history of mankind[۱۲][۱۳][۱۴][۱۵][۱۶][۱۷] Total fertility rate declined from 7 births/woman in 1979 to 1.9 births/woman in 2006[۱۸] | ۲۰۰۵–۱۰ |
| Adolescent fertility rate: Births/1000 females aged 15-19 سالs | ۱۳۹ | ۱۸۵ | بانک جهانی | 19.14 births/1000 Females aged ۱۵–۱۹; رتبهed from highest rates to lowest; More info: UNICEF statistics بایگانیشده در ۱ ژانویه ۲۰۱۱ توسط Wayback Machine | ۲۰۰۵ |
| فهرست کشورها بر پایه جمعیت مهاجر | ۲۱ | ۱۹۲ | سازمان ملل متحد | Immigrants in Iran: 1.05% of total جهان immigrant population or 1,959,000; 2.861% of Iran's national population | ۲۰۰۵ |
| Foreign Refugees Population | ۱ | ۱۱۰ | سازمان ملل متحد | Host to the جهان's largest and longest staying foreign refugees population;[۱۹][۲۰][۲۱][۲۲][۲۳] Mostly Iraqi and Afghan refugees; More info: Afghan Refugees in Iran; As of 2010 there are more than 3 million Afghan refugees living in Iran, and in the prior three decades Iran has been host to an average refugee population of over 5 million[۲۴] | ۱۹۹۹ |
| فهرست کشورها بر پایه متوسط سن مردم | ۱۲۰ | ۲۳۰ | اطلاعاتنامه جهان | Total median age: 27; Male median age: 26.8; Female median age: 27.2; More info: جهان map of median age | ۲۰۰۸ |
| Age distribution pyramid comparison | — | — | اداره آمار آمریکا | Comparison of Iran's population pyramid over time with other countries | ۱۹۹۰–۲۰۵۰ |
| جمعیت در سال ۲۰۱۵ | ۱۸ | ۲۲۵ | سازمان ملل متحد | At سال 2015, population will be: 79,917,000; At سال 2020, population will be: 83.7 million;[۲۵] Total population of Iran will hit 100 million by 2030; The figures are for population inside Iran and does not include the سال 2006 population of ایرانیان مقیم خارج of 5 million (with an estimated net worth of over $1.3 trillion) & فرار مغزها در ایران;[۲۶] Total population of Iranians all over the جهان will hit 100 million by 2025[۲۷] | ۲۰۰۴ |
| فهرست کشورها بر پایه سن اولین ازدواج | — | — | سازمان ملل متحد | ۲۷٫۷ سالs for men, 23.9 سالs for women | ۲۰۰۴ |
اقتصاد[ویرایش]
| عنوان | رتبه | از بین | منبع | توضیحات | سال |
|---|---|---|---|---|---|
| فهرست کشورها بر پایه تولید ناخالص داخلی (برابری قدرت خرید) | ۱۸ | ۱۹۳ | بانک جهانی | GDP (PPP)= 843.86 billion dollars; More info: Future GDP (PPP) estimates; Among Asian and Pacific countries | ۲۰۰۹ |
| GDP (PPP) per capita | ۵۹ | ۱۶۶ | بانک جهانی | GDP (PPP) per capita= $11,666; More info: Future GDP (PPP) per capita estimates; Among Asian countries; Iran's GDP/Capita from 1800 to 2009 | ۲۰۰۸ |
| فهرست کشورها بر پایه تولید ناخالص داخلی | ۲۶ | ۱۸۲ | بانک جهانی | GDP (nominal)= 385.2 billion dollars; Iran will be the جهان's 16th largest economy in GDP (nominal) terms by 2025[۲۸] Iran's GDP (nominal) forecast according to EIU: 2010=$411 billion, ۲۰۱۱=$472 billion, ۲۰۱۲=$545 billion, ۲۰۱۳=$626 billion, ۲۰۱۴=$705 billion, ۲۰۱۵=$804 billion;[۲۹][۳۰][۳۱] More info: Among Asian and Pacific countries; Future GDP (nominal) estimates | ۲۰۰۸ |
| فهرست کشورها بر پایه سرانه تولید ناخالص داخلی | ۷۳ | ۱۷۰ | بانک جهانی | GDP (nominal) per capita= $5,441; More info: List of countries by future GDP (nominal) per capita estimates; Iran's GDP (nominal) per capita will reach US $32,676 by 2050;[۲۸] Among Asian and Pacific countries | ۲۰۰۸ |
| GDP (PPP) per person employed | ۳۶ | ۸۷ | اطلاعاتنامه جهان | US $39,696 per person employed; 33% of the total population is employed | ۲۰۰۹ |
| GNI per capita (PPP) | ۵۷ | جهان | بانک جهانی | Average national income (PPP) of $11,490 per person/سال؛ More info: United Nations Statistics Division | ۲۰۰۹ |
| GNI per capita (nominal) | ۹۳ | جهان | بانک جهانی | Iran's 2007 GNI (nominal) per capita=US $4,530; More info: Iran's GNI (nominal) per capita will be~ US $12,000 by 2025,[۲۸] Iran GNI جهان comparison map | ۲۰۰۷ |
| فهرست کشورها بر پایه آهنگ رشد واقعی تولید ناخالص | ۶۸ | ۱۸۲ | صندوق بینالمللی پول | GDP growth of 20.6% (Not adjusted) | ۲۰۰۹ |
| فهرست کشورها بر پایه نرخ رشد واقعی تولید ناخالص داخلی (آخرین سال) | ۴۷ | ۲۱۷ | اطلاعاتنامه جهان | Adjusted GDP (real) growth rate of 6.5%; See also: 1990-2007 annualized GDP growth rate | ۲۰۰۸ |
| Real GDP per capita growth rate | ۹۹ | ۱۷۴ | بانک جهانی | Iran's real GDP per capita growth rate=۳٫۱٪ | ۲۰۰۶ |
| فهرست بزرگترین بازارهای مصرف | ۲۶ | جهان | سازمان ملل متحد | Size of Iran's consumer market in 2009 was ~US $196 billion; More info: بازار نوظهور & Goldman Sachs N11 Paper | ۲۰۰۹ |
| Starting a Business Index | ۴۸ | جهان | بانک جهانی | The index measures the ease of starting up a new business | ۲۰۱۰ |
| شاخص آسانی انجام کسب و کار | ۱۳۷ | ۱۸۳ | بانک جهانی | The survey was done indirectly &/or by estimation | ۲۰۱۰ |
| Business freedom index | ۷۷ | جهان | Freedom Meta-Index | Index measuring freedom for private businesses | ۲۰۱۱ |
| فهرست کشورها بر پایه نرخ وامدهی عمده بانکها | ۷۶ | ۱۵۳ | اطلاعاتنامه جهان | Prime lending rate of 12% | ۲۰۰۷ |
| فهرست کشورها بر پایه شاخص توسعه انسانی | ۷۰ | ۱۸۲ | سازمان ملل متحد / UN Human Development Report 2010 | Human development index of 0.702; Categorized among High-HDI countries; Iran رتبهs 3rd جهانwide in terms of progress in its شاخص توسعه انسانی for the past three decades[۳۲] More info: سرمایه انسانی | ۲۰۱۰ |
| Human Poverty Index | ۵۹ | ۱۳۵ | سازمان ملل متحد / Complete Report | HPI is a composite index measuring deprivations in the three basic dimensions: a long & healthy life, knowledge and a decent standard of living; Calculated using HPI-1 formula; رتبهed from least poverty index to maximum فقر index; More info: جهان Poverty Map, HDR for Iran | ۲۰۰۹ |
| National wealth per capita | ۸۸ | جهان | بانک جهانی | Iran's per capita national wealth=US $38,000; More info: Where is the wealth of nations? | ۲۰۰۰ |
| فهرست کشورها بر پایه برابری درآمد | ۴۷ | جهان | سازمان ملل متحد | Iran had a شاخص جینی of 43; Iran's Gini became 38.3 in 2007 as per UN HDR-2009 | ۱۹۹۸ |
| فهرست کشورها بر پایه نرخ تورم | ۸۳ | جهان | صندوق بینالمللی پول | تورم[۳۳]rate of ~8%[۳۴] More info: شاخص قیمت مصرفکننده & Iranian online consumer price monitor | ۲۰۱۰ |
| فهرست بودجه دولت بر پایه کشور | ۳۲ | ۱۸۸ | اطلاعاتنامه جهان | Government revenue of $97.7 billion in 2009; 2010-2011 Total Government Budget of $347 billion[۳۵] More info: Government of Iran | ۲۰۰۹ |
| فهرست بودجه دولت بر پایه کشور | ۴ | جهان | اطلاعاتنامه جهان | Government budget surplus of 3.9 billion US dollars | ۲۰۰۹ |
| فهرست کشورها بر پایه سرمایهگذاری مستقیم خارجی در خارج از کشور | ۷۴ | جهان | اطلاعاتنامه جهان | ~6.96 billion dollars of Foreign Direct Investment in Iran by foreign entities. Iran رتبهed sixth globally in 2010 in attracting foreign investments.[۳۶] | ۲۰۰۸ |
| فهرست کشورها بر پایه سرمایهگذاری مستقیم خارجی در خارج از کشور | ۶۵ | جهان | اطلاعاتنامه جهان | 993 million dollars invested by Iranian entities outside of Iran | ۲۰۰۸ |
| فهرست کشورها بر پایه منابع مالی صندوق پول | ۲۰ | ۳۶ | Sovereign Wealth Funds Institute | Sovereign wealth fund of 23 billion dollars in oil stabilization fund (OSF) | ۲۰۰۹ |
| فهرست کشورها بر پایه سرمایهگذاری ناخالص ثابت بر اساس درصد تولید ناخالص داخلی | ۳۶ | ۱۴۵ | اطلاعاتنامه جهان | Share of gross fixed investment as % of GDP: 27.7% | ۲۰۰۸ |
| فهرست کشورها بر پایه سرانه صادرات | ۷۱ | ۱۵۴ | اطلاعاتنامه جهان | $797 of exports per capita/سال | ۲۰۰۶ |
| % of population under poverty | — | — | اطلاعاتنامه جهان، سازمان ملل متحد | % of population living on less than $1(PPP)/day=0.2%; % of population living on less than $2(PPP)/day=3.1%; % of population living on less than $1.25/day= 2%; on less than $2/day= 7%; Living below Iran's national poverty line of $11/day= 18.7%;[۳۷][۳۸][۳۹] More info: MPI | ۲۰۰۷ |
| Tax revenue as % of GDP | ۱۶۳ | جهان | بنیاد هریتج | Government tax revenue as % of GDP=۷٫۳٪ | ۲۰۰۸ |
| فهرست کشورها بر پایه توازن حساب جاری | ۴ | ۱۹۱ | صندوق بینالمللی پول | Annual account balance of +70.797 billion dollars in مازاد مصرفکننده; More info: تراز پرداختها | ۲۰۱۰ |
| current account balance as % of GDP | ۳۸ | جهان | صندوق بینالمللی پول | Current account balance as % of GDP= +4.05%; Iran has the جهان's 38th largest trade surplus as % of GDP | ۲۰۰۸ |
| General government final consumption expenditure | ۳۸ | ۱۴۵ | بانک جهانی | General government final consumption is the total government expenditure excluding capital investments; Iran: 15,826,440,000 constant 2000 US$ | ۲۰۰۵ |
| ذخیره طلا | ۱۷ | جهان | صندوق بینالمللی پول | 320 tonnes of Gold reserves; More info: جواهرات ملی ایران | ۲۰۱۱ |
| List of countries by foreign exchange reserves | ۱۷ | جهان | بانک جهانی | >$100 billion of forex reserves, More info: Central Bank of Iran | ۲۰۱۰ |
| فهرست کشورها بر پایه واردات | ۴۳ | ۱۹۳ | اطلاعاتنامه جهان | Annual import bill of $67.79 billion | ۲۰۰۸ |
| فهرست کشورها بر پایه صادرات | ۳۵ | ۱۹۴ | اطلاعاتنامه جهان | Total annual exports of $70.16 billion | ۲۰۰۹ |
| Stock market performance | ۲ | جهان | بلومبرگ بیزینسویک | In July 2010, بورس اوراق بهادار تهران became the جهان’s second-best performing شاخص بازار سهام،[۴۰] with the تهران having a market capitalization of $125 billion by April 2011[۴۱] | ۲۰۱۰ |
| فهرست کشورها بر پایه نرخ بیکاری | ۷۵ | جهان | سازمان ملل متحد | Unemployment rate of 11.3%; رتبهed from highest unemployment rate to lowest; More info: Unreported employment | ۲۰۰۹ |
| Difficulty of hiring index | ۱۰ | ۱۵۴ | بانک جهانی | Measures the difficulty to hire workers; Index of Iran: 78 | ۲۰۰۴ |
| Difficulty of firing index | ۱۱۸ | ۱۵۴ | بانک جهانی | Measures the difficulty to fire workers; Index of Iran: 10 | ۲۰۰۴ |
| Primary exports as % of manufactured exports | ۹ | ۱۱۷ | بانک جهانی | Primary export is 93% of total manufactured exports, mostly oil | ۲۰۰۰ |
| Compensation of employees as % of total business expenses | ۱۴ | ۱۳۵ | بانک جهانی | 47.14% of business expense is employee compensation | ۲۰۰۵ |
| فهرست کشورها بر پایه ترکیببندی تولید ناخالص داخلی | ۳۵ | ۱۹۷ | اطلاعاتنامه جهان | Agriculture=11.2%; Industry= 41.7% ; Service= 47.1%; Share of oil related activity in total GDP is less than 10%[۴۲] | ۲۰۰۵ |
| Real Growth in Total Trade | ۷۳ | جهان | بانک جهانی | The average annual growth rate of the total exports and imports in goods and services at constant 2000 U.S. dollars; This indicator reflects the trade expansion of a country over the period | ۲۰۰۸ |
| Public debt as % of GDP | ۱۱۴ | جهان | اطلاعاتنامه جهان | Total public debt stands at 16.2% of تولید ناخالص داخلی; رتبهed from highest total government debt to lowest; Iran has the 20th smallest public debt/GDP in the جهان؛ More info: IMF estimates of future gross government debt | ۲۰۱۰ |
| فهرست کشورها بر پایه بدهی خارجی | ۸۴ | جهان | اطلاعاتنامه جهان | رتبهed from the highest debt to lowest; Total external debt of 12.84 billion dollars; Or 3.7% of GDP; Or $166 per person; 4th least indebted country in the جهان by external debt to GDP ratio | ۲۰۱۰ |
| Total Debt Service | ۳۳ | ۱۳۵ | بانک جهانی | Approximately $2.52 billion paid/سال to foreign creditors in interest & principal repayment | ۲۰۰۵ |
| $ external debt as /$1000 of GDP | ۱۷۴ | ۱۸۶ | اطلاعاتنامه جهان | $۶۱٫۶۰/$1000 of GDP | ۲۰۰۶ |
| فهرست کشورها بر پایه نیروی کار | ۲۲ | ۱۸۵ | اطلاعاتنامه جهان | Total labour force of 24.35 million people, more info: مالیات در ایران | ۲۰۰۸ |
| % of Industry in total Labour force | ۱۵ | ۱۳۹ | بانک جهانی | 30.4% of labour force work in industry | ۲۰۰۵ |
| % of Agriculture in total labour force | ۴۷ | ۱۳۹ | بانک جهانی | 24.9% of labour force work in agriculture | ۲۰۰۵ |
| % of female employment in industry | ۵ | ۱۳۰ | بانک جهانی | 28.4% of all industrial labour force is female | ۲۰۰۵ |
| % of female employment in agriculture | ۲۹ | ۱۳۰ | بانک جهانی | ۳۴٫۲٪ از کل مشارکت زنان در کار کشاورزی | ۲۰۰۵ |
| Economic activity growth of females | ۶ | ۱۵۶ | سازمان بینالمللی کار | ۳۴٪ رشد مشارکت زنان در امور اقتصادی | ۱۹۹۰–۲۰۰۰ |
| فهرست حداقل دستمزد کشورهای مختلف جهان | — | — | وزارت امور خارجه ایالات متحده آمریکا | ۳٬۰۳۰٬۴۸۰ ریال ایرانs (US $303) per month & revised annually; Gross average annual wage of $6,700; i.e. 60% of GDP per capita[۴۳][۴۴][۴۵] | ۲۰۰۹ |
| Retirement pension as % of GDP | ۵۶ | ۵۸ | سازمان ملل متحد/صندوق بینالمللی پول | Iran spends 1.1% of its GDP on national pensions; 5% of Iran's population is 65 yrs old & above; In 2009 for every بازنشستگی there were fifteen active workers & by 2050 this ratio is going to fall to three workers per retiree | ۲۰۰۹ |
| International Property Rights Index | Property Rights Alliance | Iran not رتبهed | |||
| Exclusive Economic Zone Area | — | — | Sea around us | Exclusive economic zone of 168,718 km2 | ۲۰۰۸ |
| Index of Economic Freedom | ۱۷۱ | ۱۷۹ | 2008 Heritage Foundation Index of economic freedom | Survey was done indirectly &/or by estimation | ۲۰۱۱ |
| فهرست کشورها بر پایه نرخ بهره بانک مرکزی | ۷۵ | جهان | اطلاعاتنامه جهان | Annualized interest rate set by the central bank to charge commercial banks for short term loans; More info: فهرست بانکهای ایران | ۲۰۱۱ |
| فهرست کشورها بر پایه نرخ وامدهی عمده بانکها | ۷۶ | جهان | اطلاعاتنامه جهان | Averaged annualized interest rate charged by the commercial banks on new loans to their most trustworthy customers; More info: بانک ملی ایران | ۲۰۰۷ |
| Gross savings as % of Gross National Income | ۶ | ۱۷۲ | بانک جهانی | Gross savings of 41.57% of GNI | ۲۰۰۵ |
| Highest Marginal Tax Rate on High Income | ۶ | ۱۰۹ | بانک جهانی | 6th highest marginal tax rate for individual income exceeding ۱۱۴٬۱۰۱٫۴$; More info: Tax rates around the جهان & Taxation in Iran | ۲۰۰۶ |
| Taxes on income, profits and capital gains as % of total taxes | ۱۱ | ۱۳۷ | بانک جهانی | Ratio: 58.84% | ۲۰۰۵ |
| Number of micro, small & medium enterprises | ۲۱ | ۱۱۵ | بانک جهانی | 1,255,382 Enterprises | ۱۹۹۷ |
| Number of micro, small & medium enterprises/1000 people | ۶۸ | ۱۱۳ | بانک جهانی | 20.62 Enterprises/1000 people | ۱۹۹۷ |
| International aid received as % of national GDP | ۱۲۰ | ۱۲۹ | سازمان همکاری اقتصادی و توسعه | International aid received is less than 0.1% of تولید ناخالص داخلی; ~$100 million; The only international aid received is as part of سازمان ملل متحد and Illegal drug trade, chiefly opiates smuggling | ۲۰۰۲ |
| Largest Islamic Banking Sector | ۱ | جهان | The Banker | Iran has the جهان's largest Islamic banking sector valued at 235.5 billion US dollars[۴۶][۴۷][۴۸] | ۲۰۰۹ |
| Least valued currency units | ۴ | جهان | صندوق بینالمللی پول | Iranian rial is the جهان's 4th least valued currency unit; More info: Compare historical devaluation of ایران with that of Turkish lira & Capital control | ۲۰۰۹ |
| جهان's largest black markets[پیوند مرده] | ۱۹ | جهان | Havocscope Black Markets Database | Size of Iran's بازار سیاه is over US $10.64 billion; Largest black markets in Iran are that of alcohol قاچاق ($912.5 million), Drug smuggling ($8.5 billion), Petroleum smuggling ($1.3 billion), Cigarette smuggling, تنفروشی، قاچاق اسلحه، فساد، Pirated movies and نقض قوانین حق تکثیر.[۴۹][۵۰] More info: Smuggling in Iran | ۲۰۰۹ |
| Freedom from taxes index | ۶۹ | جهان | Freedom Meta-Index | Index measuring tax free status of different countries | ۲۰۱۱ |
آموزش و پرورش[ویرایش]
| عنوان | رتبه | از بین | منبع | توضیحات | سال |
|---|---|---|---|---|---|
| فهرست کشورها بر پایه نرخ باسوادی | ۱۱۳ | ۱۷۷ | سازمان ملل متحد | 82.4% of adult population باسوادی; Total illiteracy rate of 6.2% of population in 2002 improving from 52.5% in 1976[۵۱] Total literacy rate (age 6 & over): 92.7%;[۱۰] More info: سوادآموزی تابعی & Aliteracy, سواد علمی & School leaving age | ۲۰۰۵ |
| Education Index | ۱۱۲ | ۱۷۶ | سازمان ملل متحد | Iran's educational index= 0.804; More info: Technological literacy & سواد علمی & سواد اطلاعاتی & علوم شناختی | ۲۰۰۸ |
| Book titles published per سال | ۷ | جهان | Book titles published per country per سال | ۶۵٬۰۰۰ Book titles published annually;[۵۲][۵۳] More info: Iran Book News Agency | ۲۰۱۰ |
| Number of book titles published in applied sciences | ۱۶ | ۹۹ | سازمان ملل متحد | 2,426 Book titles in applied sciences published | ۱۹۹۹ |
| Number of book titles published in arts & recreation | ۱۸ | ۹۳ | سازمان ملل متحد | 733 Book titles in arts & recreation published | ۱۹۹۹ |
| Number of book titles published in psychology & philosophy | ۱۳ | ۸۳ | سازمان ملل متحد | 706 Book titles in psychology & philosophy published | ۱۹۹۹ |
| Number of book titles published in theology | ۲ | ۹۶ | سازمان ملل متحد | 4,504 Book titles in theology published | ۱۹۹۹ |
| Number of book titles published in literature | ۵۴ | ۹۸ | سازمان ملل متحد | 247 Book titles in literature published | ۱۹۹۹ |
| Number of book titles published in generalities | ۱۲ | ۸۸ | سازمان ملل متحد | 612 Book titles in generalities published | ۱۹۹۹ |
| Number of book titles published in philology | ۳ | ۹۱ | سازمان ملل متحد | 1,486 Book titles in linguistics published | ۱۹۹۹ |
| Number of book titles published in pure sciences | ۷ | ۹۴ | سازمان ملل متحد | 1,844 Book titles in pure sciences published | ۱۹۹۹ |
| Number of book titles published in social sciences | ۳۰ | ۹۹ | سازمان ملل متحد | 1,319 Book titles in social sciences published | ۱۹۹۹ |
| Number of Library Books Per capita | ۷۲ | ۸۱ | سازمان ملل متحد | ~6 library books per 1,000 people | ۲۰۰۴ |
| Literacy rate of men aged 15-24 | ۵۴ | ۱۵۵ | سازمان ملل متحد | 98.1% of male population 15-24 yrs old are literate | ۲۰۰۵ |
| Female to Male ratio of School enrollment | ۱ | ۱۹۷ | سازمان ملل متحد | 1.223 females per one male student[۵۴] | ۲۰۰۵ |
| Number of Secondary education students | ۸ | ۱۸۵ | بانک جهانی | 9,942,201 students in secondary schools | ۲۰۰۵ |
| Female/Male ratio of literacy rate in 15-24yrs old population | ۸۷ | ۱۵۵ | سازمان ملل متحد | Female/Male ratio of literate 15–24 سالs old population: 0.99; Total female literacy rate of 76.2% in 2002 improving from 25.5% in 1976[۱۲] | ۲۰۰۵ |
| Number of pupils in primary education | ۱۷ | ۱۹۳ | بانک جهانی | 7,307,056 students in primary level schools | ۲۰۰۵ |
| Education enrollment at tertiary level | ۲۲ | ۲۰۰ | سازمان ملل متحد | 1,714,433 students at tertiary level of education; 64% of university students are female[۱۰] | ۲۰۰۲ |
| Education enrollment at tertiary level per capita | ۶۸ | ۱۸۸ | سازمان ملل متحد | 26.159 tertiary level students per 1,000 people | ۲۰۰۲ |
| Education spending as % of GDP | ۵۸ | ۱۳۲ | سازمان ملل متحد | 4.9% of GDP is spent on education | ۲۰۰۳ |
| Education budget as % of total government budget | ۱۹ | ۱۶۱ | بانک جهانی | Education budget is 22.85% of total government budget | ۲۰۰۵ |
| Total school life expectancy | ۵۸ | ۱۱۰ | سازمان ملل متحد | Citizens on average attend 11.3 سالs of schooling | ۱۹۹۹ |
| Illiteracy rate among population over 15 سالs old | ۵۲ | ۱۳۸ | سازمان ملل متحد | 20.9% of population over ۱۵ سالs old are illiterate | ۲۰۰۳ |
| School Success Index رتبه | ۲۹ | ۱۵۸ | کودکان را نجات بدهید: کودکان را نجات بدهید ۲۰۰۹ | The index is a calculated composite measure of indicators for early childhood growth & development, Under-5 survival rate, nutrition, adult female literacy rate, total fertility rate, grade 1 repetition rate, % of children از بین school & children proficiency at mathematics, reading & fine motor skills; رتبهing is among 43 developed & 115 developing countries, totaling 158; More info: روشهای مطالعه | ۲۰۰۹ |
| Country رتبه by جهان's Top Universities | ۵۵ | جهان | وبسنجی | Iran has one دانشگاه among the list of جهان's top 1000 universities & 30 among the top 5,000 universities; More info: National رتبهها of Iranian universities; Complete list for top 12,000 universities | ۲۰۰۹ |
| جهان's largest universities by enrollment | ۳ | جهان | List of largest universities by enrollment | دانشگاه آزاد اسلامی is the جهان's third largest university with more than 1.3 million students enrolled, it is also the جهان's largest private university | ۲۰۱۰ |
| جهان's Top Engineering Universities | ۱۸۴ | جهان | Quacquarelli Symonds | دانشگاه تهران stands at 184th and دانشگاه صنعتی شریف stands at 244th place among the جهان's top engineering universities | ۲۰۰۷ |
| Academic رتبهing of جهان Universities | ۴۰۱ | ۵۰۰ | ARWU | University of Tehran is رتبهed at 401st among the جهان top 500 universities; More info: ARWU 2010 Report | ۲۰۱۰ |
| Ratio of % of universities among top 500 per % share of total GDP by country[پیوند مرده] | ۳۴ | جهان | Ministry of Education (New Zealand) | رتبهing based on overall جهان universities رتبهing equalized against size of national economy to control for the fact that more wealthy nations can support their higher education systems to a greater degree due to higher funding availability thus measuring the quality of higher education adjusted for money spent on it | ۲۰۰۹ |
| Quality of math & science education | ۳۵ | جهان | مجمع جهانی اقتصاد | Measure of math & science education quality[۵۵] | ۲۰۱۱ |
انرژی[ویرایش]
| عنوان | رتبه | از بین | منبع | توضیحات | سال | ||
|---|---|---|---|---|---|---|---|
| فهرست کشورها بر پایه مصرف سرانه انرژی | ۵۷ | جهان | جهان Reمنبعs Institute | 23,748 kW·h/سال/Person. In 2010, per capita energy intensity in Iran was 15 times higher than in ژاپن and 10 times higher than the اتحادیه اروپا;[۵۶] More info: الگو:انرژی & Energy security | ۲۰۰۳ | ||
| Primary Energy Consumption | ۱۳ | جهان | آژانس بینالمللی انرژی | Energy, production of ~13.119 quadrillion یکای بریتانیایی حرارت/سال (per 2000 U.S. Dollars);[۵۷] By 2009 Iran stood at 11th جهانwide annually consuming 204.8 million TOE[۵۸] | ۲۰۰۶ | ||
| فهرست کشورها بر پایه مصرف سرانه انرژی | ۶ | جهان | آژانس بینالمللی انرژی | Energy, consumption of 7.686 quadrillion یکای بریتانیایی حرارت/سال (per 2000 U.S. Dollars);[۵۷] More info: Efficient energy use & نگهداری انرژی | ۲۰۰۶ | ||
| Energy Intensity | ۱ | جهان | آژانس بینالمللی انرژی[۵۶] | 2.5 times the Middle Eastern average in 2010; 14,120 tonnes of oil equivalent/$1 million of GDP in 2006;[۵۷] More info: توسعه انرژی & انرژی مصرفی جهان & Energy crisis & Fuel smuggling in Iran | ۲۰۱۰ | ||
| Total proven coal reserves | ۱۲ | ۵۹ | سازمان ملل متحد | 11,143 million tonnes of reserves | ۲۰۰۵ | ||
| Total coal production | ۳۲ | ۷۳ | سازمان ملل متحد | 1,330,000 tonnes per سال | ۲۰۰۵ | ||
| Aviation gasoline exports | ۶ | ۳۴ | سازمان ملل متحد | رتبهed among exporting countries; Iran:10,000 tonnes/سال | ۲۰۰۵ | ||
| Gross inland availability of aviation gasoline | ۴ | ۱۳۱ | سازمان ملل متحد | 95,000 tonnes of aviation gasoline available per سال inside country | ۲۰۰۵ | ||
| فهرست کشورها بر پایه ذخایر ثابت گاز طبیعی | ۲ | ۱۸۱ | اطلاعاتنامه جهان | Total proven reserves of 33.1 trillion cubic meters or 15.8% of the جهان's total reserves;[۵۸] More info: & میدانهای گازی ایران; Market value of Iran's total گاز طبیعی reserves at comparative international energy price of $75 per barrel of روغن stands at ~US $4 trillion[۵۹] | ۲۰۰۹ | ||
| Proven natural gas reserves per capita | ۵ | ۷۱ | اطلاعاتنامه جهان | 364,609 cubic meters per person | ۲۰۰۵ | ||
| فهرست کشورهای تولیدکننده گاز طبیعی | ۴ | ۱۸۳ | اطلاعاتنامه جهان | Annual production of 131.2 billion cubic meters[۵۸] Annual production of ~220 billion cubic meters (0.6 billion cubic meters/day) in 2010[۶۰] | ۲۰۰۷ | ||
| کشورهای مصرفکننده گاز | ۳ | ۱۸۳ | اطلاعاتنامه جهان | Total annual natural gas consumption of 131.7 billion m3; Iran has the جهان's fastest growth rate in natural gas consumption;[۵۸] Iran by 2011 had 80 سالs worth of gas reserves based on 2010 production levels;[۶۱] More info: Peak gas | ۲۰۰۹ | ||
| فهرست کشورها بر پایه صادرات گاز طبیعی | ۲۵ | ۱۸۲ | اطلاعاتنامه جهان | Annual exports of 6.2 billion cubic meters | ۲۰۰۷ | ||
| فهرست کشورها بر پایه واردات گاز طبیعی | ۲۷ | ۱۸۲ | اطلاعاتنامه جهان | Annual imports of 6.1 billion cubic meters | ۲۰۰۷ | ||
| Natural gas consumption by households | ۵ | ۶۷ | سازمان ملل متحد | Annual household natural gas usage of 1,243,256 Tera-joules | ۲۰۰۵ | ||
| فهرست کشورها بر پایه ذخایر نفتی | ۳ | ۹۷ | اطلاعاتنامه جهان | Total proven reserves of ۱۳۶٫۲ میلیارد بشکه (۲٫۱۶۵×۱۰۱۰ متر مکعب); Or ~ ۱٬۷۵۰ بشکه (۲۷۸ متر مکعب) of oil per مردم ایران; More info: نفت در نقطه اوج; Market value of Iran's total روغن reserves at international crude price of $75 per barrel stands at ~US $10 trillion[۵۹] | ۲۰۰۷ | ||
| فهرست کشورها بر پایه تولید نفت | ۴ | ۲۱۰ | اطلاعاتنامه جهان | Daily production of ~۴٫۲ میلیون بشکه (۶۷۰٬۰۰۰ متر مکعب) | ۲۰۰۸ | ||
| Oil R/P ratio | ۱ | جهان | بیپی | Iran has the جهان's highest R/P ratio of 89.4 سالs for oil | ۲۰۱۰ | ||
| فهرست کشورها بر پایه مصرف نفت | ۱۵ | ۲۰۸ | اطلاعاتنامه جهان | Daily consumption of ۱٫۶۳ میلیون بشکه (۲۵۹٬۰۰۰ متر مکعب) | ۲۰۰۶ | ||
| فهرست کشورها بر پایه صادرات نفت | ۸ | ۲۰۵ | اطلاعاتنامه جهان | Daily exports of ۲٫۲۱ میلیون بشکه (۳۵۱٬۰۰۰ متر مکعب); More info: بورس نفت ایران، OPEC Annual Statistical Bulletin | ۲۰۰۹ | ||
| Oil exports per capita | ۲۰ | ۸۴ | سازمان ملل متحد | 1.94 tonnes exported annually per person (~۱۲ بشکه (۱٫۹ متر مکعب)/Person/سال) | ۲۰۰۵ | ||
| فهرست کشورها بر پایه واردات نفت | ۵۲ | ۲۰۶ | اطلاعاتنامه جهان | Iran imports ۱۵۳٬۶۰۰ بشکه (۲۴٬۴۲۰ متر مکعب) of oil per day | ۲۰۰۴ | ||
| Total hydrocarbon reserves (Combined reserves of Oil & Gas) | ۲ | جهان | Oil & Gas Journal | Total هیدروکربن reserves of Iran comprising of both روغن and گاز طبیعی measured in barrel of oil equivalent (boe) stands at 301.7 billion just after عربستان سعودی's 302.5 billion boe and ahead of روسیه's 198.3 billion boe; Alternatively Iranian government puts the total reserve at 324 billion boe;[۶۲] Iran is the only country with large reserves of both gas and oil; Iran is also the only country with large hydrocarbon reserves which has the potential to massively increase its production due to its current low production levels;[۶۳][۶۴] More info: Energy superpower | ۲۰۱۰ | ||
| انرژی هستهای | جهان | آژانس بینالمللی انرژی اتمی | Current Iranian nuclear generated electricity capacity is: 0 MWh;
Iran plans to produce 23,000 MWh of رآکتور هستهای electricity in future[۶۵] using 19 nuclear power plants;[۶۶] More info: برنامه هستهای ایران & Economics of new nuclear power plants & List of nuclear reactors & Large nuclear power plants & تأسیسات هستهای ایران & فهرست نیروگاههای ایران | ۲۰۱۰ | |||
| فهرست کشورها بر پایه ذخایر اورانیوم / اورانیم | جهان | جهان Nuclear Association | As of 2010, Iran does not have significant proven reserves of اورانیم | ۲۰۱۰ | |||
| فهرست کشورها بر پایه تولید برق | ۱۹ | ۲۱۰ | اطلاعاتنامه جهان | ~193.3 Tera-Watt-Hour/سال؛ More info: Electricity in Iran through history & فهرست نیروگاههای ایران | ۲۰۰۷ | ||
| فهرست کشورها بر پایه مصرف برق | ۲۰ | ۱۹۰ | اطلاعاتنامه جهان | Consumption of 136.2 Tera-Watt-Hour/سال؛ Or 224 Watt-Hour per Person; All settlements with 20 or more families are electrified;[۶۷] More info: Voltage & Frequency Around The جهان | ۲۰۰۵ | ||
| فهرست کشورها بر پایه صادرات برق | ۳۹ | ۱۸۶ | اطلاعاتنامه جهان | Annual exports of ~2.8 Tera-Watt-Hour; Iran's electricity exports rose to 5.5 TWh in 2009[۶۸] | ۲۰۰۶ | ||
| فهرست کشورها بر پایه واردات برق | ۴۶ | ۱۸۸ | اطلاعاتنامه جهان | Electricity imports of 2.54 TWh/سال | ۲۰۰۶ | ||
| Electricity production per capita | ۸۶ | ۲۱۴ | اطلاعاتنامه جهان | ~2,747 kWh per capita/سال | ۲۰۰۶ | ||
| Electric power transmission losses as % of total output | ۳۰ | ۱۳۱ | بانک جهانی | Electrical transmission loss: 16.88% of output; More info: شبکه هوشمند (توزیع انرژی) & تورین برقی & SuperSmart Grid | ۲۰۰۴ | ||
| Natural gas consumption by power plants | ۵ | ۹۷ | سازمان ملل متحد | Annual usage of 1,379,527 Tera-joules by نیروگاهs | ۲۰۰۵ | ||
| Electricity from renewable res | — | — | سازمان ملل متحد | Annual production of: نیروی برقآبی=16.1 TWh, انرژی بادی=128 GWh, زیستتوده=0 GWh, انرژی خورشیدی=1 GWh, گرادیان زمین گرمایی=0 GWh; More info: انرژی بادی در ایران | ۲۰۰۵ | ||
| Installed wind power capacity | ۳۵ | ۷۶ | جهان Wind Energy Association | Current installed capacity of 82 MWh; Iran's installed Wind power capacity growth rate= 49.4%; More info: | ۲۰۰۸ | ||
| Largest hydroelectric power stations | ۴۴ | ۴۸ | List of largest hydroelectric power stations | Power stations with 2000 MW capacity or more; Iran operates 3 such سدs از بین 48 in the جهان؛ Total number of dams: 186 operational, 91 under construction; رتبهed 3rd جهانwide in terms of dams under construction[۱۰] More info: انرژی در ایران & فهرست سدهای ایران & List of hydroelectric power stations | ۲۰۱۰ | ||
| Diesel usage by power plants | ۶ | ۱۷۱ | سازمان ملل متحد | 2,708,000 tonnes of diesel used by thermal power plants | ۲۰۰۵ | ||
| Annual refinery output of diesel | ۱۳ | ۱۲۴ | سازمان ملل متحد | Annual production of 24,443,000 tonnes diesel | ۲۰۰۵ | ||
| Electricity produced from natural gas | ۶ | ۹۶ | بانک جهانی | 125,393 GWh produced from natural gas | ۲۰۰۴ | ||
| Inland availability of diesel oils | ۱۱ | ۱۹۱ | سازمان ملل متحد | 21,976,000 tonnes of diesel available per سال | ۲۰۰۵ | ||
| Household consumption of diesel | ۸ | ۱۴۹ | سازمان ملل متحد | 6,374,000 tonnes/سال | ۲۰۰۵ | ||
| Private investment in public energy infrastructure | ۱۳ | ۹۳ | بانک جهانی | $۶۵۰٬۰۰۰٬۰۰۰/سال | ۲۰۰۴ | ||
| Kerosene consumption by household & other consumers | ۴ | ۱۷۴ | سازمان ملل متحد | 6,043,000 tonnes/سال | ۲۰۰۵ | ||
| Kerosene imports per سال | ۳ | ۱۶۶ | سازمان ملل متحد | 1,105,000 tonnes imported/سال | ۱۹۹۷ | ||
| Coal imports | ۵۰ | ۱۱۰ | سازمان ملل متحد | 520,000 tonnes imported/سال | ۲۰۰۵ | ||
| Liquefied Petroleum Gas Exports | ۱۲ | ۹۳ | سازمان ملل متحد | 1,791,000 tonnes exported/سال | ۲۰۰۵ | ||
| Total motor gasoline (petrol) production | ۱۶ | ۱۲۱ | سازمان ملل متحد | Annual gasoline production of 11,154,000 tonnes | ۲۰۰۵ | ||
| Motor gasoline energy balance requirement | ۲ | ۲۰۵ | سازمان ملل متحد | Energy balance requirement of 6,677,000 tonnes of gasoline (petrol); Energy balance requirement is that amount of energy a country needs to import for its needs due to its local non-availability because of production shortage | ۲۰۰۵ | ||
| Motor Gasoline (Petrol) Imports | ۵ | ۲۰۰ | سازمان ملل متحد | 6,677,000 tonnes imported/سال | ۲۰۰۵ | ||
| Natural Gasoline Production | ۴ | ۲۱ | سازمان ملل متحد | 1,855,000 tonnes Produced | ۲۰۰۵ | ||
| Residual fuel oil consumption by households | ۳ | ۱۱۶ | سازمان ملل متحد | 1,619,000 tonnes/سال consumed by households | ۲۰۰۵ | ||
| Jet fuel imports | ۶۴ | ۱۶۶ | سازمان ملل متحد | Annual importation of 80,000 tonnes of جیپی-۵ | ۱۹۹۰ | ||
| Annual output of jet fuel | ۳۷ | ۱۰۸ | سازمان ملل متحد | Annual production of 850,000 tonnes jet fuel | ۲۰۰۵ | ||
| Least expensive diesel by country | ۲ | جهان | German government | Diesel fuel prices in Iran are the second cheapest in the جهان؛ One liter of diesel costs in commodity barter comparison: ~0.3 of a hen egg[۶۹] | ۲۰۰۵ | ||
| Least expensive gasoline by country | ۸ | جهان | German government | Gasoline (petrol) fuel prices are the 8th cheapest in the جهان؛ Iran spends 8% of its total state revenue, subsidizing fuel for domestic market[۶۹] | ۲۰۰۵ |
محیط زیست و بومشناسی[ویرایش]
| عنوان | رتبه | از بین | منبع | توضیحات | سال |
|---|---|---|---|---|---|
| Environmental Sustainability Index | ۱۳۲ | ۱۴۶ | دانشگاه ییل | Survey was done indirectly &/or by estimation | ۲۰۰۵ |
| فهرست کشورها بر پایه سرانه انتشار گازهای گلخانهای | ۷۴ | جهان | جهان Reمنبعs Institute | Based on data for کربن دیاکسید، متان، دی نیتروژن مونوکسید، perfluorocarbon, hydrofluorocarbon, هگزا فلوراید گوگرد emissions as well as effects of land use change; Iran= 7.6 tonnes of Carbon dioxide equivalent per person/سال | ۲۰۰۰ |
| Number of species under threat of extinction | ۳۷ | ۱۵۸ | سازمان ملل متحد | 54 species under سیاهه قرمز گونههای در معرض خطر | ۱۹۹۹ |
| Happy Planet Index | ۸۱ | ۱۷۸ | New Economics Foundation | Happy planet index is a measure of the environmental efficiency of supporting citizens well-being; Iran's index: 47.23 | ۲۰۰۹ |
| Environmental Performance Index | ۷۸ | ۱۵۳ | دانشگاه ییل/دانشگاه کلمبیا | Iran's index=60.0[۷۰] More info: Over-consumption and Dashboard of Sustainability | ۲۰۱۰ |
| فهرست کشورها بر پایه مجموع منابع تجدیدپذیر آب | ۵۸ | ۱۵۱ | اطلاعاتنامه جهان | Iran has total renewable water reمنبعs of 137.5 Cubic Kilometers; More info: امنیت آب & منابع آب & Peak water | ۲۰۰۸ |
| Water availability per capita | ۱۱۶ | ۱۴۱ | سازمان ملل متحد | Annual fresh water availability of 630 cubic meters per person; Measure of internal renewable water (average annual surface runoff & groundwater recharge generated from endogenous precipitation) | ۲۰۰۱ |
| Biodiversity Richness | ۱۳ | ۵۳ | جهان Conservation Monitoring Centre | Biodiversity Richness Index: 2 | ۱۹۹۴ |
| Carbon efficiency | ۲۸ | ۱۴۱ | Carbon Dioxide Information Analysis Center | 2.36 tonnes of CO2 emissions/$ of GDP | ۲۰۰۵ |
| Coral reefs area | ۱۹ | ۲۸ | سازمان ملل متحد | 700 km2 of آبسنگ مرجانیs | ۲۰۰۵ |
| Endangered species protection | ۷۱ | ۱۴۱ | CITES | 69.6% of CITES requirement met | ۲۰۰۰ |
| آمار استفاده کشورها از زمین | ۱۶ | ۱۷۶ | اطلاعاتنامه جهان | Total cultivated land area of 221,400 Square Kilometers | ۲۰۰۵ |
| فهرست کشورها بر پایه سرانه تولید کربن دیاکسید | ۷۰ | ۲۱۰ | سازمان ملل متحد | 5.8 tonnes of CO2 emissions per person; More info: CO2 emissions per person map | ۲۰۰۳ |
| فهرست کشورها بر پایه تولید دیاکسید کربن | ۱۱ | ۲۱۰ | سازمان ملل متحد | 466,976,000 tonnes of carbon dioxide emissions or ~ 1.6% of جهان's total emissions | ۲۰۰۶ |
| فهرست کشورها بر پایه مساحت جنگلها | ۴۷ | ۲۲۰ | سازمان ملل متحد | 110,750 Square kilometers of جنگلs | ۲۰۰۷ |
| فهرست کشورها بر پایه استفاده از آب | ۱۱ | ۱۶۸ | اطلاعاتنامه جهان | Total annual water withdrawal of 72.88 km3; Annual per capita withdrawal of 1,048 m3; رتبه of 19th by per capita withdrawal; 91% agriculture, 7% domestic, 2% industrial share of withdrawal | ۲۰۰۰ |
| فهرست کشورها بر پایه اثرات زیستمحیطی | — | — | Global Footprint Network | Iran has local ecological deficit of -1.7 global hectares per person | ۲۰۰۶ |
| Industrial Water Pollution | ۱۴ | ۱۲۹ | بانک جهانی | Metal industry contribution to total اکسیژن مورد نیاز بیولوژیکی (BOD) emissions: 15.55% | ۲۰۰۳ |
اطلاعات کلی[ویرایش]
| عنوان | رتبه | از بین | منبع | توضیحات | سال |
|---|---|---|---|---|---|
| فهرست کشورها و مناطق بر پایه پهناوری | ۱۸ | ۲۳۳ | سازمان ملل متحد | Area of 1,628,750 km2; or ~1.1% of جهان's total area | ۲۰۱۰ |
| Deadliest Blizzards in History | ۱ | جهان | List of natural disasters | بوران ۱۳۵۰ ایران of 1972 killed over 4,000 people | ۱۹۷۲ |
| Deadliest Earthquakes in History | ۸ | جهان | فهرست بلایای طبیعی | زمینلرزه ۸۵۶ دامغان killed more than 200,000 People in Iran on December 22, 856 | ۸۵۶ |
| Number of deadliest earthquakes by country | ۱ | جهان | List of natural disasters | Iran has had 9 of the جهان's most deadly earthquakes on record; رتبه is shared with China which has the same number | ۲۰۱۰ |
| Most natural disaster prone countries | ۲ | جهان | سازمان ملل متحد | Iran is the جهان's second most بلایای طبیعی country, mostly due to poor building practices and خشکسالی; More info: فهرست زمینلرزههای ایران | ۲۰۱۰ |
| Countries by number of casualties from earthquakes | ۲ | جهان | سازمان ملل متحد | Iran has the جهان's second highest number of casualties due to زمینلرزهs per one million residents; More info: The natural disasters risk index | ۲۰۱۰ |
| Number of major earthquakes | ۱ | جهان | سازمان ملل متحد | Iran has the جهان's highest number of major earthquakes (magnitude higher than 5.5 مقیاس ریشتر); Tremors occur daily somewhere in the country; More info: Online Earthquake Monitoring (With ساعت گرینویچ date & time stamp) | ۲۰۱۰ |
| فهرست کشورهای جهان بر پایه تعداد میلیاردرها | ۱۲ | ۵۸ | فهرست ایرانیان بر اساس ثروت | Only one of five Iranian billionaires, (اکبر هاشمی رفسنجانی) resides in Iran[نیازمند منبع] | ۲۰۱۰ |
| List of most charitable countries | — | — | Development Assistance Committee | Iran is not رتبهed among charitable donor nations by سازمان همکاری اقتصادی و توسعه | ۲۰۱۰ |
| جهان Giving Index | ۸۶ | جهان | Charities Aid Foundation | Iran رتبهed 86th charitable nation جهانwide with 35% of population having given money to charities, 38% of population having helped a stranger & only 12% having volunteered time; More info: جهان's most charitable nations | ۲۰۱۰ |
| Intensity of natural background radiation | ۱ | جهان | Natural background radiation at Ramsar | Highest natural radioactivity level in the جهان؛ Annual dose of 260 سیورت; More info: مسمومیت پرتوی & پرتو یونی | ۲۰۱۰ |
| Number of neighbouring countries | — | — | List of countries by number of neighbouring countries | Total of 13 bordering neighbours with 7 land border neighbours & 10 marine border neighbours & 13 unique borders; More info: Sets of four nations bordering each other | ۲۰۱۰ |
| Length of land borders | — | — | List of land border lengths | Total land border length of 5,440 km with 7 neighbouring countries and 8 unique land borders (Iran has two land borders with Azerbaijan); Total border length of 8731 km[۱۰] | ۲۰۱۰ |
| فهرست کشورها بر پایه درصد سطح آبها | ۱۰۲ | ۱۳۹ | فهرست کشورها بر پایه درصد سطح آبها | 12,000 km2 of sovereign water area or ~0.73% of total sovereign area | ۲۰۱۰ |
| فهرست کشورها بر پایه درازای خط ساحلی | ۵۰ | ۱۹۶ | فهرست کشورها بر پایه درازای خط ساحلی | 2,440 km of total coastline length excluding 740 km of coastline with Caspian sea which is landlocked | ۲۰۱۰ |
| Land Area | ۱۸ | جهان | فهرست کشورها و مناطق بر پایه پهناوری | 1,636,000 km2 of land area | ۲۰۱۰ |
| ضریب هوشی | ۹۴ | ۱۸۵ | IQ and Global Inequality | Iran is رتبهed at 94th place in terms of the average IQ of its citizens with an average national IQ of 84 | ۲۰۰۶ |
| جهان's largest islands | ۲۷۲ | جهان | فهرست جزیرهها بر اساس قاره | جزیره قشم with an area of 1,336 km2 is the جهان's 272nd largest island; (گرینلند is جهان's largest); More info: فهرست جزایر بر حسب مرتفعترین نقطه | ۲۰۱۰ |
| جهان's highest points by country | ۲۲ | جهان | فهرست کشورهای جهان بر پایه بلندترین نقطه | کوه دماوند with height of 5,610 m (18,406 ft); Damavand is also one of هفت کوه آتشفشانی; More info: فهرست کوههای ایران & Extreme points of Earth | ۲۰۱۰ |
| جهان's lowest points | ۱۷ | جهان | فهرست کشورهای جهان بر پایه پستترین نقطه | دریای خزر with a depth of 28 m below see level is the جهان's 17th deepest natural point | ۲۰۱۰ |
| جهان's largest deserts | ۲۳ | جهان | List of deserts by area | دشت کویر is the 23rd & کویر لوت is the 25th largest desert in the جهان | ۲۰۱۰ |
| Most livable green countries | ۸۳ | ۱۴۱ | ریدرز دایجست | Composite measure of شاخص توسعه انسانی & ESI | ۲۰۰۸ |
| فهرست کشورها بر پایه مصرف سرانه چای | ۵ | جهان | جهان Market Research | Annual per capita چای consumption of 1.2 kg | ۲۰۰۴ |
| فهرست کشورها بر پایه مصرف سرانه قهوه | ۱۳۲ | جهان | جهان Res Institute | Annual per capita قهوه consumption of 0.1 kg | ۲۰۰۶ |
| Wheat consumption per capita | ۷ | جهان | نظام فدرالی ایالات متحده آمریکا | سالly consumption of ~195 kg per person | ۲۰۰۴ |
| Southern most point by country | ۱۲۷ | جهان | List of countries by southernmost point | South east of استان سیستان و بلوچستان at 25°03'35"N | ۲۰۱۰ |
| Northernmost point by country | ۶۰ | جهان | List of countries by northernmost point | استان آذربایجان غربی region at 39°46'38"N | ۲۰۱۰ |
| فهرست کشورها بر پایه شرقیترین نقطه | ۴۴ | جهان | فهرست کشورها بر پایه شرقیترین نقطه | استان سیستان و بلوچستان region at 63°18'03"E | ۲۰۱۰ |
| Westernmost point by country | ۱۴۶ | جهان | List of countries by westernmost point | استان آذربایجان غربی region at 44°02'50"E | ۲۰۱۰ |
| Hottest Places on Planet Earth | ۱ | جهان | ناسا | Gandom-Beriyan in کویر لوت is the جهان's hottest place with a recorded temperature of 70.7 °C (159 °F);[۷۱][۷۲][۷۳] More info: Iran Meteorological Organization & List of weather records (where it states a record of 87 °C (188 °F) in Abadan, Iran in June 1967) & Climate records | ۲۰۰۵ |
| تهران | ۱ | جهان | سیانان | تهران is the جهان's least expensive capital city based on Cost-of-living index and is overall the second cheapest city after کراچی in the جهان[۷۴][۷۵]; Cost of living comparison between two cities | ۲۰۰۷ |
| جهان's Tallest Towers | ۵ | جهان | فهرست بلندترین ساختمانها و سازهها در جهان | برج میلاد is the جهان's fifth tallest tower & 14th tallest freestanding structure; More info: فهرست بلندترین سازههای ایران & List of tallest freestanding structures in the جهان | ۲۰۱۰ |
| Largest oil gushers in history | ۱ | جهان | Oil gusher | Qum wildcat oil gusher blew on August 26, 1956 and had an uncontrollable gusher of ۱۲۵٬۰۰۰ بشکه در روز (۱۹٬۹۰۰ متر مکعب در روز) for three months before it was contained | ۲۰۱۰ |
| جهان's oldest trees | ۳ | جهان | Earth Watchers Center | سرو ابرکوه with over 4,000 سالs of age is the جهان's third oldest tree | ۲۰۱۰ |
| فهرست بزرگترین ورزشگاههای جهان | ۱۱ | جهان | فهرست بزرگترین ورزشگاههای جهان | ورزشگاه آزادی تهران with a seating capacity of 100,000 people is the جهان's 11th largest sports stadium as well as being the جهان's فهرست ورزشگاههای جهان بر اساس گنجایش and جهان's 44th largest sporting venue | ۲۰۱۰ |
| جهان's largest covered stadiums | ۲۹ | جهان | List of covered stadiums by capacity | Azadiye Stadium with a seating capacity of 40,000 people is the جهان's 29th largest covered stadium | ۲۰۱۰ |
جهانیسازی[ویرایش]
| عنوان | رتبه | از بین | منبع | توضیحات | سال |
|---|---|---|---|---|---|
| Global Competitiveness Report | ۶۲ | ۱۴۲ | مجمع جهانی اقتصاد | Report measures global economic competitiveness[۷۶] | ۲۰۱۱ |
| Globalization Index | ۱۶۲ | ۱۸۱ | KOF Globalization Index | Survey was done indirectly &/or by estimation | ۲۰۱۰ |
| Globalization Index | ۶۲ | ۶۲ | A.T. Kearney/فارن پالیسی | Survey was done indirectly &/or by estimation | ۲۰۰۶ |
بهداشت و سلامت[ویرایش]
| عنوان | رتبه | از بین | منبع | توضیحات | سال |
|---|---|---|---|---|---|
| Suicide Rate | ۹۹ | ۱۰۶ | سازمان بهداشت جهانی | Listed from highest suicide rate to lowest; Iran: Males=0.3/100,000 people, Females=0.1/100,000 people, Total=0.2/100,000 people; More info: As per WHO in 2002 there were 8.2 deaths per 100,000 people in Iran due to intentional self inflicted injuries[۷۷] | ۲۰۰۸ |
| فهرست کشورها بر پایه سرانه مصرف سیگار | ۶۷ | ۱۲۱ | سازمان بهداشت جهانی | 764 Cigarettes smoked per adult per سال؛ سازمان بهداشت جهانی put the prevalence of smoking for the سال 2005 in ۱۵+ سال old's as: 5.5% of females & 29.6% of males;[۷۸] More info: Tobacco Use Prevalence in Iran & تأثیرات تنباکو بر سلامت انسان | ۲۰۰۷ |
| فهرست کشورها بر پایه مصرف الکل | ۱۶۳ | جهان | سازمان بهداشت جهانی | Per capita alcohol consumption of 1.02 liters per سال؛ More info: Alcohol and cancer & سیروز کبدی | ۲۰۰۵ |
| % of population with access to essential drugs | ۵۴ | ۱۶۳ | سازمان بهداشت جهانی | Categorized in medium access level of 80%; Number of factories producing medicine: 122[۱۰] | ۲۰۰۰ |
| Female % of HIV positive population 15+ سالs | ۱۰۷ | ۱۱۲ | بانک جهانی | 16.67% of over-۱۵ سالs old HIV+ population is female | ۲۰۰۵ |
| Incidence of tuberculosis per 100,000 people | ۱۴۴ | ۲۰۰ | بانک جهانی | 23.48 per 100,000 People; 100% of all patients are under proper medical treatment as per سازمان بهداشت جهانی guidelines[۷۹] | ۲۰۰۵ |
| Physicians per 1000 people | ۱۳۸ | ۲۰۲ | بانک جهانی | 0.45 physicians/1000 people; Alternative سازمان بهداشت جهانی 2005 indicators: Total Physicians=61,870, Pharmaceutical personnel density=0.2/1000 People, Nursing and midwifery personnel density=1.6/1000 People, Dentistry personnel density=0.2/1000 People[۸۰] | ۲۰۰۴ |
| فهرست کشورها بر پایه شیوع و مصرف مواد مخدر | ۱ | ۱۳۲ | سازمان ملل متحد | Prevalence rate of 2.8% of population; Almost all opiates smuggled into Iran from Afghanistan; Initiation age for most Iranian addicts is their 20s;[۸۱] More info: رتبهها of most harmful drugs | ۱۹۹۹ |
| Annual cannabis use by country | ۳۱ | ۶۷ | سازمان ملل متحد | Annual prevalence rate of 4.2% of population | ۱۹۹۹ |
| HIV/AIDS prevalence rate | ۱۵۳ | ۱۷۱ | اطلاعاتنامه جهان | HIV/AIDS Prevalence Rate of 0.1% of Population; Recent سازمان بهداشت جهانی report puts the number of HIV+ people at 110,000 people or ~0.16% of population in 2007 & accelerating;[۸۲][۸۳] In past the primary mode of transmission was by syringe sharing among drug addicts but it is now being replaced by high risk sexual contacts;[۸۴] Iran in 2003 had over 700,000 cases of بیماریهای آمیزشیs[۸۵] | ۲۰۰۱ |
| Deaths due to HIV/AIDS | ۴۷ | ۱۵۳ | اطلاعاتنامه جهان | 4,300 people die annually because of AIDS/HIV infection; Recent سازمان بهداشت جهانی report puts the number of deaths at 6,000 in 2007[۸۲] سازمان بهداشت جهانی report puts the coverage of antiretroviral therapy at 6%[۸۲] | ۲۰۰۷ |
| Prevalence of HIV among population aged 15-49 سالs | ۱۰۴ | ۱۴۸ | بانک جهانی | Listed from highest rate to lowest; Iran: 0.15% of 15-49 سال old's are HIV+; Recent سازمان بهداشت جهانی report puts the % of HIV+ 15-49 سال old's at 0.3% in 2007[۸۲] | ۲۰۰۵ |
| Access to Sanitation | ۲۲ | ۱۲۹ | اطلاعاتنامه جهان | 99% of population have access to proper sanitation | ۲۰۰۳ |
| فهرست کشورها بر پایه درصد جمعیت مبتلا به سوء تغذیه | ۷۶ | ۷۶ | سازمان ملل متحد | Listed from highest malnourishment rates to lowest; Iran: less than 5% of population is سوءتغذیه; More info: Fruit and Vegetable Consumption in Iran & Nutrition Landscape Information System for Iran & United Nations map of the جهان showing % of national population suffering from undernourishment | ۲۰۰۹ |
| Prevalence of contraceptive use among women | ۲۵ | ۱۷۶ | بانک جهانی | 74% of women aged 15–49 use contraceptives; alternately رتبهed by سازمان ملل متحد at 12th/89 with 73% prevalence; Most widely used method is "contraceptive pill";[۸۶] More info: Contraceptive security | ۲۰۰۰ |
| Hospital beds/1000 people | ۱۳۳ | ۱۹۱ | بانک جهانی | Hospital beds/1000 population: 1.6/1000; 758 hospitals, 225,000 hospital beds, 438 emergency centers[۱۰] | ۲۰۰۱ |
| Underweight children rate | ۶۳ | ۹۵ | سازمان ملل متحد | رتبهing is from highest rate to lowest; Iran: ~2% of children are underweight | ۲۰۰۵ |
| Global Hunger Index | — | — | International Food Policy Research Institute / جهان Map of Hunger | Iran رتبهed among countries with low prevalence of سوءتغذیه; More info: گرسنگی | ۲۰۱۰ |
| فهرست کشورها بر پایه کالری دریافتی در رژیم غذایی | ۴۰ | جهان | فائو | Iranians on average consume 3040 kcal/person/day; More info: تغذیه | ۲۰۰۷ |
| Malaria cases per 100,000 of population | ۷۲ | ۹۴ | سازمان ملل متحد/Complete report for Iran | رتبهing is from highest rate to lowest; مالاریا cases in Iran: 27/100,000 of population | ۲۰۰۱ |
| % of 1 سال old babies immunized against Diphtheria, Pertussis & Tetanus | ۱ | ۱۸۷ | سازمان ملل متحد | 99% of babies immunized against دیفتری، سیاهسرفه & کزاز | ۲۰۰۲ |
| % of 1 سال old babies immunized against Hepatitis B | ۱ | ۱۱۴ | سازمان ملل متحد | 99% of babies immunized against هپاتیت ب | ۲۰۰۲ |
| % of 1 سال old babies immunized against measles | ۱ | ۱۸۶ | سازمان ملل متحد | 99% of babies immunized against سرخک | ۲۰۰۲ |
| % of 1 سال old babies immunized against Poliomyelitis | ۱ | ۱۸۷ | سازمان ملل متحد | 99% of babies immunized against فلج اطفال | ۲۰۰۲ |
| % of 1 سال old babies immunized against Tuberculosis | ۱ | ۱۵۳ | سازمان ملل متحد | 99% of babies immunized against سل | ۲۰۰۲ |
| % of routine EPI vaccination financed by government | ۱ | ۱۳۳ | سازمان ملل متحد | 100% of all routine واکسیناسیونs financed by government | ۲۰۰۲ |
| جهان رتبهing of overall national health systems | ۹۳ | ۱۹۰ | سازمان بهداشت جهانی | رتبهed from best overall مراقبت سلامت systems to worst; More info: سواد سلامت | ۲۰۰۰ |
| جهان رتبهing of national health system performance & attainment | ۵۸ | ۱۹۱ | سازمان بهداشت جهانی | رتبهing is based on composites of overall health care system, health level & distribution, responsiveness level & distribution, fairness in financial contribution, overall health goals attainment and per capita health expenditure | ۱۹۹۷ |
| Total health expenditure per capita | ۶۹ | جهان | سازمان بهداشت جهانی | US $678 spent on health per person; Total health expenditure is 6.8% of GDP (PPP) | ۲۰۰۶ |
| % of under-5 سال old children with ARI taken to health provider | ۳ | ۸۰ | سازمان ملل متحد | 93% of children with عفونت دستگاه تنفسی فوقانی taken to health provider | ۲۰۰۲ |
| % of total births attended by skilled health staff | ۳۵ | ۱۵۸ | کودکان را نجات بدهید | 97% of all births attended by skilled health staff; رتبهed among 43 developed & 115 developing countries, totaling ۱۵۸ | ۲۰۰۹ |
| Expenditure on health as % of GDP | ۷۵ | ۱۸۸ | بانک جهانی | 6.6% of GDP is spent on health | ۲۰۰۴ |
| % of babies exclusively breastfed for 6 months | ۳۰ | ۱۲۵ | سازمان ملل متحد | 44% of babies exclusively شیردهی for the first six months of life; More info: Facts on Breastfeeding | ۱۹۹۵–۲۰۰۲ |
| % of households consuming iodized salt | ۱۵ | ۱۱۲ | سازمان ملل متحد | 94% of households consume iodized salt | ۱۹۹۷–۲۰۰۲ |
| از بین pocket health expenditure as % of private expenditure on health | ۶۴ | ۱۸۷ | بانک جهانی | 94.8% of private health expenditure is از بین pocket; More info: Health care system & Publicly-funded health care | ۲۰۰۴ |
| Prepaid plans as % of private health expenditure | ۷۵ | ۱۸۷ | سازمان بهداشت جهانی | Prepaid plans constitute 2.9% of private health funding; More info: مراقبت سلامتی همگانی | ۲۰۰۲ |
| Government expenditure on health per capita | ۸۴ | ۱۸۵ | سازمان بهداشت جهانی | Government spends 206$ per person/سال | ۲۰۰۲ |
| Total expenditure on health per capita | ۶۹ | ۱۸۵ | سازمان بهداشت جهانی | Total health expenditure by government & private sectors: 432$ Per capita/سال | ۲۰۰۲ |
| Total population suffering from undernourishment | ۹۲ | ۱۰۳ | فهرست کشورها بر پایه درصد جمعیت مبتلا به سوء تغذیه | Listed from highest rate to lowest; Iran: 4% of population is undernourished[۸۷] | ۲۰۰۶ |
| Probability of not reaching 40 سالs of age | ۷۳ | ۱۱۱ | سازمان ملل متحد | Listed from highest probability to lowest; Iran: 9.3% | ۲۰۰۱ |
| Probability of reaching 65 سالs of age (males) | ۶۲ | ۱۵۹ | سازمان ملل متحد | Listed from highest probability to lowest; Iran: 68.9% | ۲۰۰۰ |
| Probability of reaching 65 سالs of age (females) | ۹۱ | ۱۵۹ | سازمان ملل متحد | Listed from highest probability to lowest; Iran: 74.3% | ۲۰۰۰ |
| Total number of kidney transplants/سال | ۲۰ | ۴۷ | جهانwide Transplant Center Directory | 228 kidneys transplanted in 2002; Iran رتبهed 4th جهانwide in 2007 with more than 2000 transplants performed annually[۸۸][۸۹] | ۲۰۰۲ |
| Kidney transplants per capita | ۳۵ | ۴۷ | جهانwide Transplant Center Directory | 3.35205 kidney transplants per 1 million people/سال | ۲۰۰۲ |
| Countries by total disability-adjusted life سال (DALY) rate | ۱۱۰ | ۱۹۴ | سازمان بهداشت جهانی | Iran has total DALY rate of 175.2 سالs per 1000 of population; رتبهed from highest DALY rate to lowest; More information: The burden of disease & injury in Iran & Global burden of disease & جهان Health Statistics 2009 | ۲۰۰۴ |
| Countries by disability-adjusted life سال (DALY) rate for Tuberculosis | ۱۱۸ | ۱۹۴ | سازمان بهداشت جهانی | DALY rate of 0.78 سال/1000 people for سل; رتبهed from highest DALY rate to lowest | ۲۰۰۴ |
| Countries by disability-adjusted life سال (DALY) rate for Sexually Transmitted Diseases (STDs) excluding HIV/AIDS | ۱۰۰ | ۱۹۴ | سازمان بهداشت جهانی | DALY rate of 1.1 سالs/1000 people for بیماریهای آمیزشیs excluding HIV/AIDS; رتبهed from highest DALY rate to lowest | ۲۰۰۴ |
| Countries by disability-adjusted life سال (DALY) rate for HIV/AIDS | ۱۰۲ | ۱۹۴ | سازمان بهداشت جهانی | DALY rate of 0.83 سال/1000 people for ایدز; رتبهed from highest DALY rate to lowest | ۲۰۰۴ |
| Countries by disability-adjusted life سال (DALY) rate for Diarrhea | ۸۹ | ۱۹۴ | سازمان بهداشت جهانی | DALY rate of 4.4 سالs/1000 people for اسهال; رتبهed from highest DALY rate to lowest | ۲۰۰۴ |
| Countries by disability-adjusted life سال (DALY) rate for Meningitis | ۱۲۲ | ۱۹۴ | سازمان بهداشت جهانی | DALY rate of 0.50 سال/1000 people for مننژیت; رتبهed from highest DALY rate to lowest | ۲۰۰۴ |
| Countries by disability-adjusted life سال (DALY) rate for Hepatitis B | ۸۸ | ۱۹۴ | سازمان بهداشت جهانی | DALY rate of 0.14 سال/1000 people for هپاتیت ب; رتبهed from highest DALY rate to lowest; Higher DALYs in risk groups e.g. truck drivers[۹۰] | ۲۰۰۴ |
| Countries by disability-adjusted life سال (DALY) rate for Hepatitis C | ۸۹ | ۱۹۴ | سازمان بهداشت جهانی | DALY rate of 0.07 سال/1000 people for هپاتیت سی; رتبهed from highest DALY rate to lowest | ۲۰۰۴ |
| Countries by disability-adjusted life سال (DALY) rate for Respiratory Infections | ۱۰۵ | ۱۹۴ | سازمان بهداشت جهانی | DALY rate of 4.62 سالs/1000 people for عفونت دستگاه تنفسیs; رتبهed from highest DALY rate to lowest | ۲۰۰۴ |
| Countries by disability-adjusted life سال (DALY) rate for Maternal conditions | ۷۶ | ۱۹۴ | سازمان بهداشت جهانی | DALY rate of 5.49 سالs/1000 people for Maternal conditions; رتبهed from highest DALY rate to lowest | ۲۰۰۴ |
| Countries by disability-adjusted life سال (DALY) rate for Perinatal conditions | ۷۷ | ۱۹۴ | سازمان بهداشت جهانی | DALY rate of 15.97 سالs/1000 people for Perinatal conditions; رتبهed from highest DALY rate to lowest | ۲۰۰۴ |
| Countries by disability-adjusted life سال (DALY) rate for Malnutrition | ۹۳ | ۱۹۴ | سازمان بهداشت جهانی | DALY rate of 4.24 سالs/1000 people for سوءتغذیه; رتبهed from highest DALY rate to lowest; More info: Obesity in Iran & Obesity Scale Country Comparison & Facts on Malnutrition & Map of Obesity | ۲۰۰۴ |
| Countries by disability-adjusted life سال (DALY) rate for Cancers | ۱۴۸ | ۱۹۴ | سازمان بهداشت جهانی | DALY rate of 7.63 سالs/1000 people for سرطان; رتبهed from highest DALY rate to lowest; More info: Cancer Country Profile | ۲۰۰۴ |
| Countries by disability-adjusted life سال (DALY) rate for Diabetes | ۱۲۱ | ۱۹۴ | سازمان بهداشت جهانی | DALY rate of 2.77 سالs/1000 people for مرض قند; رتبهed from highest DALY rate to lowest | ۲۰۰۴ |
| Countries by disability-adjusted life سال (DALY) rate for Neuro-Psychiatric conditions | ۴۶ | ۱۹۴ | سازمان بهداشت جهانی | DALY rate of 34.41 سالs/1000 people for Neuro-Psychiatric diseases: Neurological+Psychiatric conditions; رتبهed from highest DALY rate to lowest | ۲۰۰۴ |
| Countries by disability-adjusted life سال (DALY) rate for diseases of sensory organs | ۴۹ | ۱۹۴ | سازمان بهداشت جهانی | DALY rate of 12.84 سالs/1000 people for diseases of Sensory organs: Eye diseases+Ear diseases ; رتبهed from highest DALY rate to lowest | ۲۰۰۴ |
| Countries by disability-adjusted life سال (DALY) rate for Cardiovascular diseases | ۸۰ | ۱۹۴ | سازمان بهداشت جهانی | DALY rate of 21.63 سالs/1000 people for بیماری قلبی-عروقی; رتبهed from highest DALY rate to lowest; More info: Physical Inactivity Prevalence in Iran & Raised Cholesterol Prevalence in Iran & Raised Blood Pressure Prevalence in Iran | ۲۰۰۴ |
| Countries by disability-adjusted life سال (DALY) rate for Respiratory diseases | ۱۳۴ | ۱۹۴ | سازمان بهداشت جهانی | DALY rate of 6.18 سالs/1000 people for Respiratory diseases; رتبهed from highest DALY rate to lowest | ۲۰۰۴ |
| Countries by disability-adjusted life سال (DALY) rate for Digestive diseases | ۱۶۹ | ۱۹۴ | سازمان بهداشت جهانی | DALY rate of 3.44 سالs/1000 people for Digestive diseases; رتبهed from highest DALY rate to lowest | ۲۰۰۴ |
| Countries by disability-adjusted life سال (DALY) rate for Genito-Urinary diseases | ۱۲۳ | ۱۹۴ | سازمان بهداشت جهانی | DALY rate of 1.86 سالs/1000 people for Genito-urinary diseases; رتبهed from highest DALY rate to lowest; More info: Prevalence of circumcision | ۲۰۰۴ |
| Countries by disability-adjusted life سال (DALY) rate for Skin diseases | ۱۴۵ | ۱۹۴ | سازمان بهداشت جهانی | DALY rate of 0.42 سالs/1000 people for آبدانهs; رتبهed from highest DALY rate to lowest | ۲۰۰۴ |
| Countries by disability-adjusted life سال (DALY) rate for Musculoskeletal diseases | ۱۳۰ | ۱۹۴ | سازمان بهداشت جهانی | DALY rate of 3.83 سالs/1000 people for Musculoskeletal diseases; رتبهed from highest DALY rate to lowest; Example: Burden of osteoporosis in Iran | ۲۰۰۴ |
| Countries by disability-adjusted life سال (DALY) rate for Congenital Anomalies | ۸۲ | ۱۹۴ | سازمان بهداشت جهانی | DALY rate of 4.41 سالs/1000 people for Congenital anomalies; رتبهed from highest DALY rate to lowest | ۲۰۰۴ |
| Countries by disability-adjusted life سال (DALY) rate for Oral diseases | ۳۷ | ۱۹۴ | سازمان بهداشت جهانی | DALY rate of 2.13 سالs/1000 people for Oral diseases; رتبهed from highest DALY rate to lowest | ۲۰۰۴ |
| Countries by disability-adjusted life سال (DALY) rate for All Accidents | ۲۹ | ۱۹۴ | سازمان بهداشت جهانی | DALY rate of 29.7 سالs/1000 people for حادثه; رتبهed from highest DALY rate to lowest; More info: Economic compensation of accidental injuries in Iran | ۲۰۰۴ |
| Countries by disability-adjusted life سال (DALY) rate for Intentional Injuries | ۱۳۸ | ۱۹۴ | سازمان بهداشت جهانی | DALY rate of 3.2 سالs/1000 people for Intentional Injuries; رتبهed from highest DALY rate to lowest; Economic loss of 0.49% of GDP/سال due to violence & intentional injuries[۹۱] | ۲۰۰۴ |
| Total healthy life expectancy at birth | ۱۱۹ | ۱۹۲ | سازمان بهداشت جهانی | Total امید زندگی of 57.6 سالs on average at birth; رتبهed from highest healthy life expectancy to lowest | ۲۰۰۴ |
| Male healthy life expectancy at birth | ۱۱۷ | ۱۹۲ | سازمان بهداشت جهانی | Male امید زندگی of 56.1 سالs on average at birth; رتبهed from highest healthy life expectancy to lowest | ۲۰۰۴ |
| Male healthy life expectancy at 60 سالs of age | ۱۳۲ | ۱۹۲ | سازمان بهداشت جهانی | Male امید زندگی of 10.4 سالs on average at 60 سالs of age; رتبهed from highest healthy life expectancy to lowest | ۲۰۰۴ |
| Female healthy life expectancy at birth | ۱۱۸ | ۱۹۲ | سازمان بهداشت جهانی | Female امید زندگی of 59.1 سالs on average at birth; رتبهed from highest healthy life expectancy to lowest | ۲۰۰۴ |
| Female healthy life expectancy at 60 سالs of age | ۱۲۱ | ۱۹۲ | سازمان بهداشت جهانی | Female امید زندگی of 11.9 سالs on average at 60 سالs of age; رتبهed from highest healthy life expectancy to lowest | ۲۰۰۴ |
| Expectation of lost healthy سالs at birth (Male) | ۲ | ۱۹۲ | سازمان بهداشت جهانی | امید زندگی of 10.4 سالs on average at birth; رتبهed from highest loss of healthy سالs to lowest; Iran is 2nd after یمن in the جهان & followed by عراق | ۲۰۰۴ |
| Expectation of lost healthy سالs at birth (Female) | ۱ | ۱۹۲ | سازمان بهداشت جهانی | امید زندگی of 12.5 سالs on average at birth; رتبهed from highest loss of healthy سالs to lowest; Iran has the highest loss of healthy سالs for females in the جهان | ۲۰۰۴ |
| Stockpiles of antiviral drugs for Pandemic Influenza | Stockpiling antiviral medications for pandemic influenza | Reserve supply of essential antiviral medications in case of pandemic influenza; Data not available for Iran | ۲۰۱۰ | ||
| Urban sulfur dioxide pollution | ۱ | ۱۴۱ | سازمان بهداشت جهانی | City SO2 concentration: 209 micrograms/m3; More info: WHO map of deaths due to air pollution | ۱۹۹۵ |
| Country رتبه by Top جهان Hospitals | ۲۱ | جهان | وبسنجی | Iran has one بیمارستان among جهان's top 200 hospitals, 2 in top 500 and 4 in top 1000 | ۲۰۰۹ |
تاریخ و فرهنگ[ویرایش]
| عنوان | رتبه | از بین | منبع | توضیحات | سال |
|---|---|---|---|---|---|
| فهرست کشورها بر پایه تاریخ ایجاد | ۱ | جهان | فهرست کشورها بر پایه تاریخ ایجاد | Iran with its inception in 3200 BC, is the oldest country in the جهان. More info: تاریخ ایران & فهرست کشورها بر پایه تاریخ ایجاد | ۲۰۱۰ |
| رتبهبندی گردشگری جهان | ۵۵ | جهان | سازمان ملل متحد | 2.5 million foreign tourists visited Iran in ۲۰۰۷; رتبهed by Iranian government at 68th جهانwide; 641 hotels with 63,000 beds; Tourism generates 1.8% of employment[۹۲] More info: گردشگری در ایران & Official Iran Tourism Website & Tourism Competitiveness | ۲۰۰۷ |
| جدول مکانی میراث جهانی بر پایه منطقه | ۱۲ | ۲۳۹ | سازمان ملل متحد | ۱۲ میراث جهانی یونسکوs; More info: List of the جهان heritage sites | ۲۰۱۰ |
| دیوار بزرگ گرگان | ۲ | جهان | List of walls | دیوار بزرگ گرگان is the second longest defensive wall in existence after the دیوار چین | ۲۰۱۰ |
| جهان's oldest artificial water reservoirs | ۱ | جهان | Qanat | The جهان's oldest water reservoir is in گناباد، is more than 2700 سالs old & is still in use; It is also the جهان's largest qanat; More info: معماری ایرانی | ۲۰۱۰ |
| International Tourist Arrivals per سال | ۵۹ | ۱۵۲ | سازمان ملل متحد | 740,000 International tourists visit Iran/سال؛ More info: نیاز به روادید برای ایرانیان | ۲۰۰۰ |
| International tourism expenditure | ۲۸ | ۱۵۸ | بانک جهانی | Amount Iranian tourists spent in 2004 on their international visits: 4.4 billion dollars; Alternative survey by سازمان ملل متحد put the figure at $4.6 billion for the سال 2006 & the amount International tourists spent in Iran for the same سال at $1.2 billion[۹۳] | ۲۰۰۴ |
| جواهرات ملی ایران | ۱ | جهان | جواهرات ملی ایران | جهان's largest collection of سنگهای قیمتیs | ۲۰۱۰ |
| Number of former national capitals | ۱ | جهان | List of former national capitals | Highest number of national capital relocations; Iran has had 31 former capitals before تهران[۹۴] | ۲۰۱۰ |
| گاهشماری ایران | ۱ | جهان | گاهشماری ایران | Most accurate solar calendar in use | ۲۰۱۰ |
| فهرست بزرگترین امپراتوریهای جهان | ۱ | جهان | فهرست بزرگترین امپراتوریهای جهان | هخامنشیان (480 BC) was the largest ancient empire in history | ۲۰۱۰ |
| فهرست بزرگترین امپراتوریهای جهان | ۱۴ | جهان | فهرست بزرگترین امپراتوریهای جهان | هخامنشیان with an area of 7.7 million km2, was the 14th largest empire to have ever existed | ۲۰۱۰ |
| فهرست بزرگترین امپراتوریهای جهان | ۱۵ | جهان | فهرست بزرگترین امپراتوریهای جهان | افشاریان with an area of 4 million km2, is the 15th largest among modern empires | ۲۰۱۰ |
| فهرست بزرگترین امپراتوریهای جهان | ۸ | جهان | فهرست بزرگترین امپراتوریهای جهان | هخامنشیان is the 8th largest contiguous empire of all times | ۲۰۱۰ |
| فهرست بزرگترین امپراتوریهای جهان | ۱۲ | جهان | فهرست بزرگترین امپراتوریهای جهان | ساسانیان with a total population of 78 million in 7th century is the 12th largest empire of all times | ۲۰۱۰ |
| فهرست بزرگترین امپراتوریهای جهان | ۱ | جهان | فهرست بزرگترین امپراتوریهای جهان | هخامنشیان with 44% of the جهان's population is the largest empire of all times in terms of the fraction of جهان's population under its control; ساسانیان is second with 37.1% | ۲۰۱۰ |
| Largest empires by percentage of جهان's GDP | ۹ | جهان | فهرست بزرگترین امپراتوریهای جهان | افشاریان with 24.24% of the جهان's تولید ناخالص داخلی is the 9th largest empire of all times | ۲۰۱۰ |
| Largest empires by the size of GDP | ۱۰ | جهان | فهرست بزرگترین امپراتوریهای جهان | افشاریان with a GDP of $119.85 billion in 1740 AD, is the 10th largest empire of all times by its size of economy | ۲۰۱۰ |
| Total duration of all empires by country | ۱ | جهان | فهرست بزرگترین امپراتوریهای جهان | Iran has the most سالs ruling as an امپراتوری in history | ۲۰۱۰ |
| قالی ایرانی | ۱ | جهان | قالی | Iran produces 3/4 of the جهان's handmade carpets; Iran has 30% share of the جهان's carpet export market;[۹۵][۹۶][۹۷][۹۸] Iran has also produced the جهان's largest handmade carpet, measuring 60,546 square feet.[۹۹][۱۰۰][۱۰۱] More info: موزه فرش ایران | ۲۰۱۰ |
| Total cinema attendance | ۱۹ | ۷۸ | سازمان ملل متحد | 26,000,000 attendances | ۲۰۰۳ |
| Number of cinema seats | ۱۵ | ۶۰ | سازمان ملل متحد | 173,000 Cinema seats in total | ۱۹۹۵ |
صنایع و معادن[ویرایش]
| عنوان | رتبه | از بین | منبع | توضیحات | سال |
|---|---|---|---|---|---|
| Iran's International رتبهها of Mining Output | — | — | — | <<< See the link provided for complete stats | — |
| جهان's Largest Petroleum Companies | ۲ | جهان | Energy Intelligence | The Iranian government-owned corporation of شرکت ملی نفت ایران after شرکت آرامکو is the جهان's largest petroleum company. | ۲۰۰۸ |
| جهان's largest mining companies | ۲۳ | جهان | بانک جهانی | Iran's national mining corporation (ایمیدرو) is the جهان's 23rd largest mining company with 0.6% of the جهان's total mining production | ۲۰۰۷ |
| جهان's Largest State Owned Corporations | ۷ | جهان | فاینانشیال تایمز | شرکت ملی نفت ایران with a market capitalization of US $220 billion in ۲۰۰۶ رتبهed 7th جهانwide. | ۲۰۰۶ |
| فهرست کشورها بر پایه نرخ رشد تولیدات صنعتی | ۱۰ | ۱۶۱ | اطلاعاتنامه جهان | Industrial growth rate of 4.0% annually; Alternatively put at 7.4% by سیاست در ایران[۱۰] | ۲۰۰۹ |
| فهرست کشورها بر پایه تولید خودرو | ۱۲ | ۵۲ | سازمان بینالمللی تولیدکنندگان وسایل نقلیه موتوری | 1,395,421 automobiles manufactured in 2009; During period 2000-2010 Iran after China had the highest growth in صنعت خودروسازی; Over 1.6 million vehicles & 1 million motorcycles were produced in 2010;[۱۰۲] More info: صنعت خودروسازی ایران | ۲۰۰۹ |
| High Technology Exports per capita | ۱۱۴ | ۱۶۷ | بانک جهانی | فناوری عالی exports are products with high R intensity, such as in nuclear, aerospace, computers, pharmaceuticals, scientific instruments and electrical machinery; Iran: ~۱٬۴۶۱ $ per 1,000 people/سال | ۲۰۰۴ |
| صنایع پتروشیمی | ۴۵ | جهان | مواد شیمیایی | Iran is the جهان's 45th largest chemical producer with an annual production sale value of 7.8 billion dollars;[۱۰۳][۱۰۴][۱۰۵][۱۰۶][۱۰۷] شرکت ملی نفت ایران of Iran with ~۱٫۶۷ میلیون بشکه در روز (۲۶۶٬۰۰۰ متر مکعب در روز) رتبهs 11th globally in terms of total پالایشگاه نفت capacity;[۱۰۸] شرکت ملی صنایع پتروشیمی ایران of Iran plans to become جهان's second largest producer of chemicals by 2015,[۱۰۹] Iran also plans to become جهان's second largest exporter of بسپارs[۱۱۰] | ۲۰۰۸ |
| Non-energy use of bitumen asphalt | ۶ | ۱۳۰ | سازمان ملل متحد | Annual use of 3,496,000 tonnes of آسفالت | ۲۰۰۵ |
| Trademarks Per capita | ۳۳ | ۱۴۲ | بانک جهانی | نشانه تجاریs are distinctive signs that identify/protect goods or services as those produced by an enterprise or individual; Iran: ~153 per 1 million people. More info: مالکیت فکری در ایران | ۲۰۰۱ |
| Non-energy use of lubricants | ۹ | ۱۴۷ | سازمان ملل متحد | 770,000 tonnes of روانسازs used annually | ۲۰۰۵ |
| Usage of naphtha by industry | ۱۳ | ۴۵ | سازمان ملل متحد | Annual use of 2,492,000 tonnes of naphtha | ۲۰۰۵ |
| Industrial electricity consumption per capita | ۷۳ | ۱۷۱ | سازمان ملل متحد | ~692 kWh per capita/سال | ۲۰۰۵ |
| Industrial use of residual oil | ۵ | ۱۴۲ | سازمان ملل متحد | 6,869,000 tonnes used/سال of مازوت | ۲۰۰۵ |
| Quantity of value added manufacturing | ۲۹ | ۱۵۵ | بانک جهانی | 21.22 billion constant سال 2000 US$/سال of ساخت | ۲۰۰۵ |
| Bagasse consumption by industry | ۲۷ | ۸۰ | سازمان ملل متحد | 1,206,000 tonnes of باگاس consumed by industry annually | ۲۰۰۵ |
| Diesel consumption by industry | ۱۵ | ۱۲۸ | سازمان ملل متحد | 1,798,000 tonnes/سال | ۲۰۰۵ |
| Total lubricant production | ۱۰ | ۸۶ | سازمان ملل متحد | Annual روانسازs production of 955,000 tonnes | ۲۰۰۵ |
| Natural gas consumption by chemical industry | ۹ | ۶۶ | سازمان ملل متحد | Annual usage of 138,966 Tera-joules | ۲۰۰۵ |
| Blast furnace gas consumption by industry | ۱۹ | ۴۷ | سازمان ملل متحد | 10,102 Tera-joules of blast furnace gas consumed/سال | ۲۰۰۵ |
| Coal consumption by industry | ۴۲ | ۸۹ | سازمان ملل متحد | 330,000 tonnes/سال | ۲۰۰۵ |
| فهرست کشورها بر پایه تولید اورانیم | جهان | جهان Nuclear Association | Currently Iran does not produce significant amounts of اورانیم | ۲۰۰۸ | |
| فهرست کشورها بر پایه تولید فولاد | ۱۶ | جهان | انجمن جهانی فولاد/US Geological Survey | More than 10.9 million tonnes/سال in 2009; Iran's production capacity reached 20 million tonnes/سال in 2010;[۱۱۱][۱۱۲] Iran plans to increase its steel production to more than 35 million tonnes/سال by 2015[۱۱۳][۱۱۴] | ۲۰۰۹ |
| فهرست کشورها بر پایه تولید مس | ۱۲ | جهان | British Geological Survey | Annual production of 249,100 tonnes | ۲۰۰۶ |
| فهرست کشورهای تولیدکننده آلومینیوم | ۱۷ | جهان | فهرست کشورهای تولیدکننده آلومینیوم | Annual production of 457,000 tonnes | ۲۰۰۶ |
| فهرست کشورها بر پایه تولید سیمان | 5[۱۱۵] | جهان | فهرست کشورها بر پایه تولید سیمان / Pie Chart of جهان's Production | 2009: Annual production of 45 million tonnes, or ~1.6% of the جهان's total output & total production capacity of 55 million tonnes annually;[۱۱۶] Iran رتبهs 10th globally in terms of cement export[۱۱۷] | ۲۰۱۰ |
| فهرست کشورهای تولیدکننده سنگ آهن | ۸ | جهان | سازمان نقشهبرداریهای زمینشناسی آمریکا | Annual production of 33 million tonnes | ۲۰۰۹ |
| Gypsum production | ۲ | جهان | British Geological Survey | Iran is the جهان's 2nd largest producer after China | ۲۰۰۶ |
| Iron ore production | ۸ | جهان | سازمان نقشهبرداریهای زمینشناسی آمریکا | Annual production of 33 million tonnes[۱۱۸] | ۲۰۰۹ |
| Production of natural iron oxide | ۹ | جهان | سازمان نقشهبرداریهای زمینشناسی آمریکا | Annual production of 2,600 tonnes | ۲۰۰۶ |
| Production of ammonia | ۲۱ | جهان | سازمان نقشهبرداریهای زمینشناسی آمریکا | Annual آمونیاک production of 1.02 million tonnes | ۲۰۰۶ |
| Reserves of Zinc | ۱ | جهان | British Geological Survey | Iran has the جهان's largest روی reserves, in addition to 2nd largest reserves of مس، ninth largest reserves of آهن and eleventh largest reserves of سرب[۱۱۹][۱۲۰][۱۲۱] | ۲۰۱۰ |
| Industrial imports by country[پیوند مرده] | ۲۸ | جهان | سازمان تجارت جهانی | Iran رتبهs 28th globally in terms of importation of industrial machinery | ۲۰۰۴ |
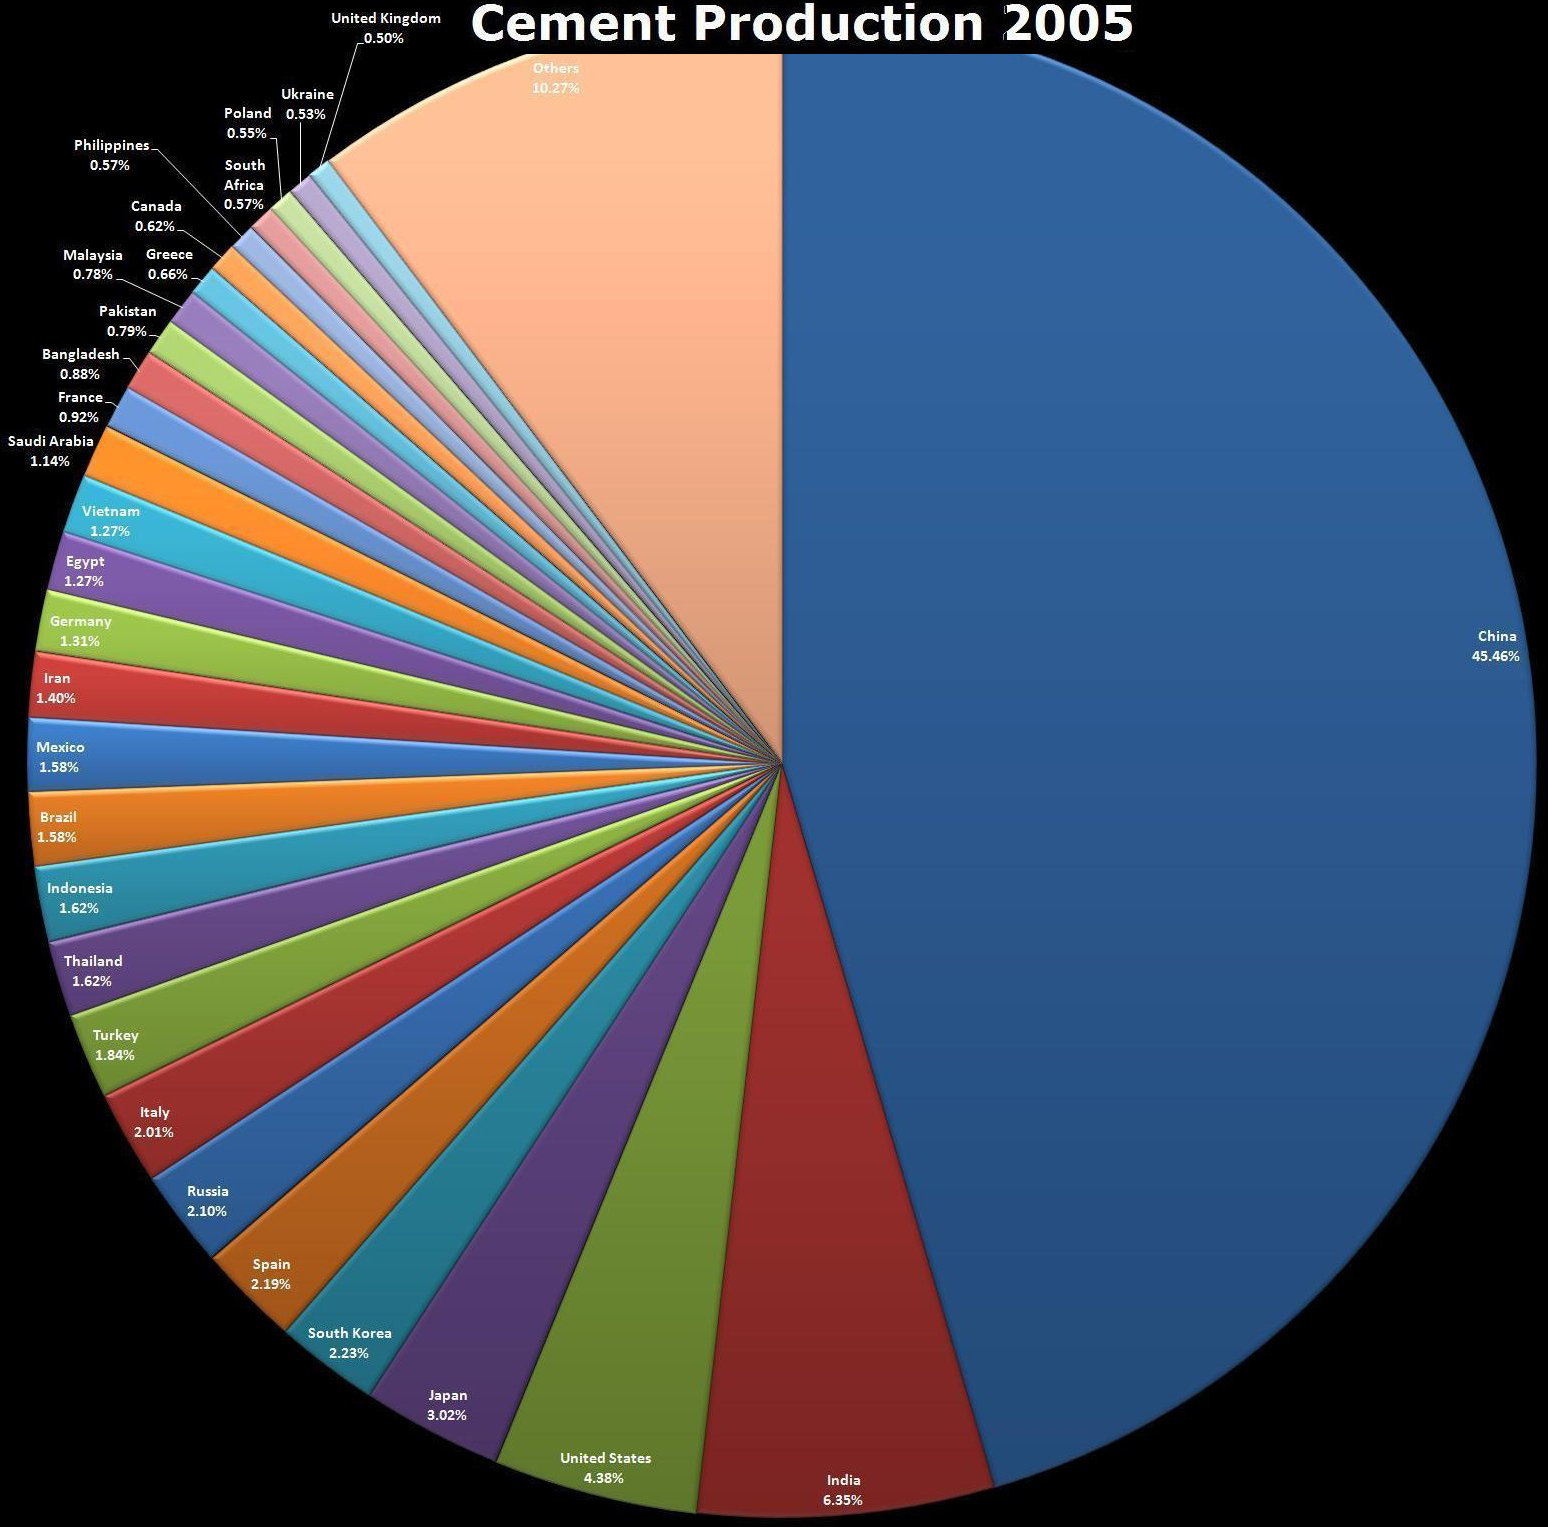
امور نظامی و دفاعی[ویرایش]
| عنوان | رتبه | از بین | منبع | توضیحات | سال |
|---|---|---|---|---|---|
| Composite Index of National Capability (CINC) | ۱۵ | جهان | Correlates of War | CINC is a statistical measure of national قدرت سخت as opposed to قدرت نرم representing demographic, economic and military strength of a nation; Index of Iran=0.013450, Index of جهان's total capability=1; More info: قدرت هوشمند & Comprehensive National Power | ۲۰۰۷ |
| فهرست کشورها بر پایه هزینههای نظامی | ۲۴ | ۱۵۴ | SIPRI | Total annual military budget of 9.17 billion dollars.[۱۲۲] In 2010 the سیاست در ایران put the total security and defence budget including that of army, IRGC, police, military R&D, intelligence agencies, etc at $17.14 billion.[۱۲۳][۱۲۴] | ۲۰۰۹ |
| List of countries by military expenditure per capita | ۶۲ | جهان | اطلاعاتنامه جهان | Iranian military per capita expenditure of US $۶۴٫۷۷ | ۲۰۰۸ |
| فهرست کشورها بر پایه هزینههای نظامی | ۳۷ | ۱۵۴ | SIPRI | Iran spends 2.7% of its GDP on its military defense; More info: Comparison of جهان's expenditure on military, health and education | ۲۰۰۸ |
| Level of military equipment | — | — | CSIS | Comparison of Iran's military hardware with that of the جهان؛ More info: تجهیزات نیروهای مسلح ایران& List of current ships of the Iranian Navy & فهرست هواپیماهای نیروی هوایی ایران & & Assessment of Iranian military by CSIS & List of military equipment manufactured in Iran | ۲۰۱۰ |
| فهرست کشورهای دارای جنگافزار هستهای | — | — | سازمان ملل متحد | Iran as member of پیماننامه منع گسترش سلاحهای هستهای currently does not possess any confirmed جنگافزار هستهایs; Iran is not under any Nuclear umbrella or in a Nuclear-weapon-free zone; More info: Countries with stockpiles of enriched weapons grade uranium; Nuclear warfare; PTBT & CTBT | ۲۰۱۰ |
| Fire Power رتبهها of Countries | ۱۲ | جهان | Global Fire Power | رتبهing based on conventional military حجم آتش; More info: List of global territorial disputes | ۲۰۱۰ |
| Total number of troops | ۷ | جهان | CSIS | Total troops numbering 3,833,000; More info: درجههای ارتش ایران | ۲۰۰۹ |
| Male manpower fit for military service | ۱۵ | ۲۳۴ | اطلاعاتنامه جهان | 17.67 million males fit for military service | ۲۰۰۹ |
| Male manpower reaching military service age annually | ۱۵ | ۲۳۴ | اطلاعاتنامه جهان | 700,213 males reach military service age annually | ۲۰۰۹ |
| فهرست کشورها بر پایه اندازه و میزان نیروهای پلیس | ۳۰ | ۶۰ | CSIS | Police force size of 40,000 personnel | ۲۰۰۶ |
| فهرست کشورها بر پایه مالکیت اسلحه | ۷۹ | ۱۷۸ | Small Arms Survey | 7.3 guns owned privately per 100 civilian residents; There were 3.5 million small arms owned by Iranian residents | ۲۰۰۷ |
| Arms exports/سال | ۳۷ | ۴۰ | SIPRI | Iran's arms exports in 2005: US $1 million; Iran is prohibited from exporting its locally manufactured military equipment by شورای امنیت; Iran is currently facing the longest sanction in modern history;[۱۲۵][۱۲۶] More info: تحریمهای علیه ایران & قانون داماتو & جنبش ضد تحریم و مداخله نظامی در ایران; Iran's weapons exports were US $2 million in 2008[۱۲۷] | ۲۰۰۵ |
| Arms imports/سال | ۱۷ | ۱۶۹ | بانک جهانی | Iran's arms imports in 2005: US $403 million; More info: Iran's weapons's imports in 2008 were US $91 million,[۱۲۷] Iran is banned from importing weapons by شورای امنیت sanctions of 2010;[۱۲۸] Iranian arms imports comparison by CSIS | ۲۰۰۵ |
| Arms imports per capita/سال | ۶۰ | ۱۶۹ | بانک جهانی | Approximately 6 dollars per Person per سال | ۲۰۰۵ |
| Most afflicted countries by WMD | ۲ | جهان | سلاح کشتارجمعی | Iran is the second most afflicted country by سلاح کشتارجمعی only after ژاپن due to WMDs used by صدام حسین against Iranian civilian & military population; Iran did not retaliate even though it was capable of doing so; There have been friendly meetings between Japanese and Iranian victims of WMD; Saddam used over 101,000 chemical munitions against Iranians during the war[۱۲۹][۱۳۰][۱۳۱][۱۳۲][۱۳۳][۱۳۴][۱۳۵] More info; Iranian victims of WMD | ۲۰۱۰ |
| جنگافزارهای شیمیایی جنگ بیولوژیک | ۱ | جهان | Iraq and weapons of mass destruction | Iran is the most afflicted country in history of mankind by جنگافزارهای شیمیایی and جنگ بیولوژیک weapons; Iranian civilian population is also the first victim of Chemical weapons in history; Estimated 100,000 Iranian civilians and military personnel were killed and another 100,000 were injured during جنگ ایران و عراق by biochemical weapons; Today Iran is at the forefront of treatment sciences for chemical injuries[۱۳۶][۱۳۷][۱۳۸][۱۳۹][۱۴۰][۱۴۱][۱۴۲][۱۴۳][۱۴۴] More info: حمله شیمیایی به حلبچه & عملیات انفال | ۲۰۱۰ |
| Deadliest wars and armed conflicts | ۱۸ | جهان | List of wars and disasters by death toll | The defensive war which جنگ ایران و عراق Iraq tried to invade Iran is the 18th most bloody war in history of mankind; Iran has not been engaged in an offensive war since the جنگ کرنال in 1739. | ۲۰۱۰ |
| فهرست کشورها بر پایه تعداد نیروهای حافظ صلح سازمان ملل متحد | ۱۰۷ | جهان | سازمان ملل متحد | Iran had two military personnel working as UN peacekeepers at conflict zones around the جهان | ۲۰۱۰ |
| Gun Rights Index | ۱۷۵ | جهان | Freedom Meta-Index | Index measures easy & legal access to privately owned firearms[۱۴۵] | ۲۰۱۱ |
سیاست[ویرایش]
| عنوان | رتبه | از بین | منبع | توضیحات | سال |
|---|---|---|---|---|---|
| شاخص صلح جهانی[۱۴۶] | ۱۰۴ | ۱۴۹ | Economist Intelligence Unit | The survey was done indirectly &/or by estimation; More info: GPI map for 2010 | ۲۰۱۰ |
| Political orientation as % of far right proponents in population | ۹ | ۶۱ | جهان Values Survey | 7.3% of population hold far right political views; More info: Map of Iran's political blogosphere | ۲۰۰۵ |
| Political orientation as % of far right proponents in population | ۴۰ | ۶۱ | جهان Values Survey | 3.9% of population hold far right political views | ۲۰۰۵ |
| جهانwide Governance Indicators | — | — | بانک جهانی/Complete report for Iran | Performance measurement of Voice & Accountability, Political Stability and Lack of Violence/Terrorism, Government Effectiveness, Regulatory Quality, Rule of Law and Control of Corruption | ۲۰۰۸ |
| شاخص احساس فساد | ۱۴۶ | ۱۷۸ | شفافیت بینالملل | Survey was done indirectly &/or by estimation | ۲۰۱۰ |
| Irregular payments & bribes | ۶۹ | جهان | مجمع جهانی اقتصاد | Extent of رشوهخواری in business environment; More info: Bribe Payers Index | ۲۰۱۰ |
| گزارشگران بدون مرز | ۱۶۶ | ۱۶۹ | گزارشگران بدون مرز | Survey was done indirectly &/or by estimation; More info: Countries رتبهed by journalists killed | ۲۰۰۷ |
| شاخص مردمسالاری | ۱۴۵ | ۱۶۷ | Economist Intelligence Unit | Survey was done indirectly &/or by estimation; More info: فهرست کشورهای جهان بر پایه سیستم حکومتی | ۲۰۰۸ |
| % Female ministers as of total ministers | ۲۳ | ۱۲۵ | Inter-Parliamentary Union | Females: 27.1% of government at ministerial level | ۲۰۰۰ |
| List of countries by Failed States Index | ۳۸ | ۱۷۷ | Fund For Peace | Survey was done indirectly &/or by estimation; More info: سیاست خارجی ایران | ۲۰۰۹ |
| Presidential election voting age population | ۱۰ | ۹۱ | Institute for Democracy and Electoral Assistance | 32,585,700 eligible voters for presidential elections; More info: سیاست در ایران | ۲۰۰۳ |
| آزادی مطبوعات | ۷۴ | ۱۹۶ | خانه آزادی | Survey was done indirectly &/or by estimations; More info: رسانه در ایران | ۲۰۰۹ |
| Limited government index | ۷۳ | جهان | Freedom Meta-Index | Index measuring the relative size of the government in people's lives | ۲۰۱۱ |
| Public trust of politicians | ۳۹ | جهان | مجمع جهانی اقتصاد | Degree of public trust in ethical standards of their politicians; More info: Public participation | ۲۰۱۰ |
دین[ویرایش]
| عنوان | رتبه | از بین | منبع | توضیحات | سال |
|---|---|---|---|---|---|
| Muslim population | ۷ | ۶۷ | فهرست کشورها بر پایه جمعیت مسلمان | 7th largest Muslim population in the جهان؛ More info: فهرست کشورها بر پایه جمعیت مسلمان | ۲۰۰۵ |
| Muslims as % of population | ۶ | ۱۶۸ | International Religious Freedom Report | 98% of population is Muslim; More info: فهرست کشورها بر پایه مذهب | ۲۰۰۴ |
| Shia's as % of total Muslim population | ۱ | ۶۷ | فهرست کشورها بر پایه جمعیت مسلمان | 89% of Muslim population of the country is شیعه | ۲۰۰۵ |
| Number of Shia Muslims by Country | ۱ | ۶۷ | فهرست کشورها بر پایه جمعیت مسلمان | 61,924,500 Shia Muslims; Second is هند with an estimated population of 40 to 55 million as per 2001 Census followed by پاکستان with an estimated Shia population of 30 to 45 million. | ۲۰۰۵ |
| Sunni's as % of total Muslim population | ۶۷ | ۶۷ | فهرست کشورها بر پایه جمعیت مسلمان | 9% of Muslim population of the country is Sunni | ۲۰۰۵ |
| Bahá'í population by country | ۲ | ۲۴۷ | Bahá'í Faith by country | Population of 150,000-500,000 | ۲۰۰۴ |
| Protestants population | ۹۸ | ۱۶۷ | Protestantism by country | Population of 204,054 | ۲۰۰۴ |
| Population of Roman Catholics | ۱۴۹ | ۱۷۰ | Roman Catholicism by country | Population of 13,603 | ۲۰۰۴ |
| مزدیسنا | ۲ | جهان | مزدیسنا | Population of 24,000-30,000 | ۲۰۰۵ |
| Jewish population of countries | ۲۴ | ۸۹ | کنگره جهانی یهودیان | ~25,000-40,000 Jews live in Iran according to various estimates[۱۴۷][۱۴۸][۱۴۹] | ۱۹۹۸ |
| فهرست بزرگترین مساجد دنیا | ۲ | جهان | فهرست بزرگترین مساجد دنیا | مسجد گوهرشاد (مشهد) near حرم علی بن موسیالرضا is the جهان's second largest مسجد after مسجد الحرام | ۲۰۱۰ |
دانش و فناوری[ویرایش]
| عنوان | رتبه | از بین | منبع | توضیحات | سال |
|---|---|---|---|---|---|
| Global Innovation Index | BCG & NAM | Iran not yet رتبهed; More info: Innovation framework map | |||
| Global Innovation Index | ۹۵ | ۱۲۵ | اینسید | Index measures enabling environment for نوآوری; More info: نبوغ & خلاقیت | ۲۰۱۱ |
| Science & Technology Growth Rate | ۱ | جهان | Science-Metrix Report / Science-Metrix country graph comparison / Government of United Kingdom | Highest science & technology growth rate in the جهان، 1000% increase in ۹ سالs (1995–2004); Iran has increased its academic publishing output from 0.0003% of جهان's total output in 1970 to 0.29% by 2004 (That is ~100000% growth in ۳۳ سالs),[۱۵۰] by 2008 Iran's share had reached 1.02% of the جهان's total output (~340000% growth in ۳۷ سالs);[۱۵۱] Iran's 2009 growth rate in علم & فناوری was highest globally being 11 times faster than the جهان's average rate; Iran has been doubling its scientific output every 3 سالs;[۱۵۲] In 2009 رتبهed at 22nd by total scientific output; 19th in ریاضیات output, 17th in علوم رایانه output, 15th in فناوری هستهای output; 28th in فیزیک output; 16th in aerospace technology output; 17th in پزشکی output, 13th in شیمی output & 15th in فناوری نانو output[۱۵۳][۱۵۴] More info: Science in newly industrialized countries; Iranian scientific publications online digital archive | ۲۰۱۰ |
| Total Research & Development spending in PPP US dollars | ۲۷ | جهان | سازمان ملل متحد | Iran spends 6.2 billion US dollars in برابری قدرت خرید terms equaling to ~0.7% of its GDP (PPP), Iran has 500 scientists & tech personnel working in R&D sector for every one million of population;[۱۵۵] More info: Iran National Science Foundation & علم سیاست علمی & Science policy & چرخه حیات تکنولوژی & Iranian cities among جهان's science cities | ۲۰۱۰ |
| Research and development spending | ۴۳ | ۶۹ | بانک جهانی | About 0.5% of GDP was spent on تحقیق و توسعه in سال 2000; Iran's spending on تحقیق و توسعه is to reach 3% of GDP by 2015;[۱۵۶] Government funds 75% of all پژوهش in Iran[۱۵۷] | ۲۰۰۰ |
| Research and development spending per capita | ۵۸ | ۶۹ | بانک جهانی | 0.007351% of national GDP per 1 million people; More info: فناوریهای نوپدید | ۲۰۰۰ |
| Technology Achievement Index | ۴۵ | ۶۸ | سازمان ملل متحد | Technology Achievement Index measures creation of technology, diffusion of recent innovations, diffusion of old نوآوریs & ; Iran's score: 0.26 از بین 1; More info: سرمایه انسانی | ۲۰۰۱ |
| Patents granted per capita | ۵۶ | ۶۰ | سازمان جهانی مالکیت فکری | 0.014702 Patents per one million people; More info: مالکیت فکری در ایران & جبرگرایی فناورانه | ۱۹۹۸ |
| Highest budget national space agencies | ۹ | جهان | فهرست سازمانهای فضایی | سازمان فضایی ایران with $500 million/سال has the 9th highest budget of a national space organization in the جهان | ۲۰۱۰ |
| First orbital launches by country | ۹ | جهان | Timeline of first orbital launches by country | Iran is the 9th country to reach space; More info: پیمان فضایی ماورای جو | ۲۰۱۰ |
| Biological space launch capability | ۶ | جهان | Animals in space | Iran is the sixth country to have launched animals into space & recover them alive | ۲۰۱۰ |
| National Spacefaring Capability | جهان | List of human spaceflight programs | Iran currently does not have the capability to launch humans into space; Iran plans to send humans to space by the start of 2019[۱۵۸][۱۵۹][۱۶۰] | ۲۰۱۰ | |
| Total human spaceflight time by country | ۲۱ | جهان | List of spaceflight records | Iran stands 21st in terms of total time spent by its nationals in space; Only one Iranian (انوشه انصاری) has spent ~11 person-days in space as a space tourist; More info: Timeline of space travel by nationality | ۲۰۰۷ |
| جهان's Top 500 Supercomputers | جهان | University of Mannheim & دانشگاه تنسی & آزمایشگاه ملی لارنس برکلی & NERSC | Ultra Fast Microprocessors Research Center in Tehran’s دانشگاه صنعتی امیرکبیر successfully built a ابررایانه in 2011 with maximum processing capacity of 34,000 billion operations per second and graphic power (واحد پردازش گرافیکی) of 22000 billion operations per second.[۱۶۱] The supercomputer is expected to be among the 500 ones of the جهان.[۱۶۱] Iran’s first supercomputer launched in 2001 was also fabricated by Amirkabir University of Technology. In 2009, a SUSE Linux-based HPC system made by the Aerospace Research Institute of Iran (ARI) was launched with 32 cores later upgraded to 96 cores. Its performance was pegged at 192 GFLOPS. The Routerlab team at the University of Tehran successfully designed and implemented an access-router (RAHYAB-300) and a 40Gbps high capacity switch fabric (UTS).[۱۶۲] Complete list of Top 500 Supercomputers | ۲۰۱۰ |
جامعه[ویرایش]
| عنوان | رتبه | از بین | منبع | توضیحات | سال |
|---|---|---|---|---|---|
| شاخص کیفیت زندگی | ۱۳۳ | ۱۹۴ | Economist Intelligence Unit | Survey was done indirectly &/or by estimations | ۲۰۱۰ |
| شاخص رفاه لگاتوم | ۹۲ | ۱۱۰ | Legatum Institute | Survey was done indirectly &/or by estimations | ۲۰۱۰ |
| فهرست کشورها بر پایه شاخص رضایت از زندگی | ۲۹ | ۱۷۸ | Measure of subjective life satisfaction | Measurement of wealth, health and access to basic education; Score of Iran=200; More info: Sociocultural evolution & Happiness economics | ۲۰۰۶ |
| Nonlinear quality of life index | ۶۷ | ۱۷۱ | Gapminder | Measures overall quality of life in a non-linear method | ۲۰۰۵ |
| فهرست کشورها بر پایه نرخ زندانی شدن | ۱۹۰ | ۲۱۷ | International Centre for Prison Studies | 222 Prisoners per 100,000 People | ۲۰۰۹ |
| % female prisoners as of total prison population | ۸۱ | ۱۳۴ | International Centre for Prison Studies | Females comprise 3.5% of prison population | ۲۰۰۳ |
| % pre-trial detainees as of total prison population | ۸۹ | ۱۴۳ | International Centre for Prison Studies | Pre-trial detainees comprise 24.8% of total prison population | ۲۰۰۳ |
| Privacy Index | Privacy International | Iran not yet رتبهed | |||
| Homicide Rate | ۶۶ | ۱۴۴ | سازمان ملل متحد | Homicide rate of 2.93 intentional murders per 100,000 people | ۲۰۰۹ |
| گزارش جهانی فاصله جنسیتی | ۱۲۳ | ۱۳۴ | مجمع جهانی اقتصاد | Survey was done indirectly &/or by estimation | ۲۰۱۰ |
| Mother's Index رتبه | ۴۹ | ۱۵۸ | کودکان را نجات بدهید: کودکان را نجات بدهید ۲۰۰۹ | The index is a calculated composite measure of indicators for health, education, equality, economic freedom, nutrition & political status related to the well being of mothers; رتبهing is among 43 developed & 115 developing countries, totaling 158 | ۲۰۰۹ |
| Women's Index رتبه | ۴۵ | ۱۵۸ | کودکان را نجات بدهید: State of the جهان's Mothers report ۲۰۰۹ | The index is a calculated composite measure of indicators for health, education, equality, economic freedom, nutrition & political status related to the well being of women; رتبهing is among 43 developed & 115 developing countries, totaling 158 | ۲۰۰۹ |
| Children's Index رتبه | ۴۵ | ۱۵۸ | کودکان را نجات بدهید: State of the جهان's Mothers report ۲۰۰۹ | The index is a calculated composite measure of indicators for health, education, equality, economic freedom, nutrition & political status related to the well being of children; رتبهing is among 43 developed & 115 developing countries, totaling 158 | ۲۰۰۹ |
| Child Development Index | ۶۸ | ۱۴۳ | کودکان را نجات بدهید: Child Development Index 2008 | Index measures education, health & nutrition of children | ۲۰۰۰–۲۰۰۶ |
| Sen Social Welfare Function | ۴۹ | جهان | List of countries by Sen social welfare function | Iran is 49th in the جهان in terms of best social welfare function | ۲۰۰۹ |
| Gender-related Development Index | ۷۶ | ۱۵۵ | سازمان ملل متحد / Complete Report | Index shows the inequalities between men and women in these areas: long and healthy life, knowledge & a decent standard of living | ۲۰۰۹ |
| Gender Empowerment Measure | ۱۰۳ | ۱۰۹ | سازمان ملل متحد / Complete Report | Index measures inequalities between men's and women's opportunities in a country | ۲۰۰۹ |
| فرار مغزها در ایران | ۱ | جهان | فرار مغزها در ایران | Iran has the highest rate of فرار مغزها in the جهان | ۲۰۰۲ |
| Sustainable Society Index | ۹۷ | جهان | SSI رتبهها for 2010[پیوند مرده] | Sustainable Society Index measures three dimensions of human, environmental and economical well being; More info: SSI 2010 complete report | ۲۰۱۰ |
| جهان's best countries بایگانیشده در ۲۸ ژوئیه ۲۰۱۱ توسط Wayback Machine | ۷۹ | جهان | نیوزویک | رتبهing of the جهان's best countries based on categories of education, health, quality of life, economic dynamism and political environment | ۲۰۱۰ |
| Drug Freedom Index | ۶۴ | جهان | Freedom Meta-Index | Index measuring access to recreational drugs; In Iran: Illegal drug trade can have punishments ranging from fines to lashings, imprisonment & death penalty; Personal drug consumption is generally overlooked by law[۱۶۳] | ۲۰۱۱ |
| Judicial independence | ۶۵ | جهان | مجمع جهانی اقتصاد | The extent of judicial independence | ۲۰۱۰ |
ترابری[ویرایش]
| عنوان | رتبه | از بین | منبع | توضیحات | سال |
|---|---|---|---|---|---|
| Merchant marine capacity | ۳۱ | ۱۴۸ | اطلاعاتنامه جهان | Iran owns a total of 188 ships of which 73 are Iranian flagged ships & 115 ships sail with foreign flags plus one additional foreign (UAE) owned ship sailing with Iranian flag; More info: کشتیرانی جمهوری اسلامی ایران; Iran also has a fleet of 46 marine tankers consisting of 28 کشتی نفتکش، 9 Suezmax, ۵ افرا مکس، 3 chemical vessels and a single LPG tanker; The total number of tankers is to be increased to 74 by 2013 and to more than 80 by 2015. ;[۱۶۴] شرکت ملی نفتکش ایران was the جهان's fifth largest tanker operator with 43 ships in 2010 & is expected to become the جهان's third largest tanker company with 74 ships in 2013[۱۶۵] | ۲۰۰۸ |
| Rail transport network size | ۲۱ | ۱۵۱ | اتحادیه بینالمللی راهآهنها | Total rail network length of 11,106 km; More info: راهآهن ایران | ۲۰۰۸ |
| فهرست کشورها بر پایه اندازه شبکه جاده | ۲۹ | ۱۹۱ | اطلاعاتنامه جهان | Total road network length of 172,927 km | ۲۰۰۶ |
| فهرست کشورها بر پایه مجموع طول خطوط لولهکشی | ۸ | ۱۲۰ | اطلاعاتنامه جهان | Total pipeline length of 36,509 km; condensate 7 km; condensate/gas 397 km; gas 19,161 km; liquid petroleum gas 570 km; oil 8,438 km; refined products 7,936 km; Iran رتبهs 4th جهانwide by natural gas pipeline length[۱۶۶] having 32,000 Km of gas pipelines in 2010[۱۶۷] Iran plans to have 70,000 km of natural gas pipelines by 2025[۱۶۸] | ۲۰۰۷ |
| Length of Liquid Petroleum Gas Pipelines | ۶ | ۱۷ | اطلاعاتنامه جهان | 570 km of الپیجی pipelines | ۲۰۰۶ |
| Length of Oil Pipelines | ۶ | ۹۷ | اطلاعاتنامه جهان | 8,256 km of oil pipelines | ۲۰۰۶ |
| Length of Refined Products Pipelines | ۲ | ۵۳ | اطلاعاتنامه جهان | 7,808 km of pipelines for refined products | ۲۰۰۶ |
| فهرست کشورها بر پایه آمار کل سیستم حمل و نقل سریع | ۲۰ | ۵۳ | فهرست کشورها بر پایه آمار کل سیستم حمل و نقل سریع | 120.1 km of rapid transit network length with 64 stations | ۲۰۰۲ |
| فهرست کشورها بر پایه سرانه وسایل نقلیه | ۵۶ | ۱۴۴ | فهرست کشورها بر پایه سرانه وسایل نقلیه | 175 automobiles per 1000 people in addition to 110 motorbikes per 1000 people; More info: صنعت خودروسازی ایران & کد بینالمللی خودرو | ۲۰۱۰ |
| فهرست کشورها بر پایه طول مسیر آبراهه | ۷۰ | ۱۰۹ | اطلاعاتنامه جهان | 850 km of آبراهs | ۲۰۰۸ |
| Air transport, freight | ۵۹ | ۱۷۶ | بانک جهانی | 98.22 million tonnes-km/سال airlifted | ۲۰۰۵ |
| Air transport, passengers carried | ۲۶ | ۱۷۷ | بانک جهانی | 12,708,350 Air passengers/سال | ۲۰۰۵ |
| Number of airports | ۲۶ | ۲۵۱ | اطلاعاتنامه جهان | 331 Operational فرودگاهs | ۲۰۰۷ |
| فهرست کشورها بر پایه تعداد فرودگاه هلیکوپتر | ۱۴ | جهان | اطلاعاتنامه جهان | 19 Operational بالگردگاهs | ۲۰۱۰ |
| Rail usage by Annual Passenger-Km Per Capita | ۲۶ | ۳۲ | اتحادیه بینالمللی راهآهنها | رتبهed among countries with more than 5 billion passenger-km/سال؛ Iran: 180 passenger-km Per Capita/سال | ۲۰۰۶ |
| Rail usage by annual Billion Tonne-Kilometers/سال | ۲۰ | ۳۲ | اتحادیه بینالمللی راهآهنها | رتبهed among countries with more than 10 billion tonne-kilometers; Iran: 20.5 billion tonne-kilometers | ۲۰۰۶ |
| فهرست متروها | ۱۸ | ۱۴۵ | Tehran Metro بایگانیشده در ۷ سپتامبر ۲۰۱۰ توسط Wayback Machine | 622.2 million passenger rides in 2010;[۱۶۹] متروی تهران is the largest and busiest metro system in آسیای جنوبی and the second largest and busiest in خاورمیانه | ۲۰۱۰ |
| Total number of Airports with paved runways | ۲۰ | ۲۲۷ | اطلاعاتنامه جهان | 129 Operational airports with paved runways | ۲۰۰۷ |
| Number of airports with paved runways, length: 2438-3047 meters | ۱۵ | ۱۶۱ | اطلاعاتنامه جهان | 28 Airport باند فرودگاهs with length of 2438 m to 3047 m | ۲۰۰۷ |
| Number of airports with paved runways, length: over 3047 meters | ۴ | ۱۶۱ | اطلاعاتنامه جهان | 40 Airport runways with length of over 3047 m | ۲۰۰۷ |
| Gasoline (Petrol) consumption by transport sector | ۱۰ | ۱۹۴ | سازمان ملل متحد | Annual gasoline (petrol) consumption of 17,854,000 tonnes by vehicles | ۲۰۰۵ |
| Jet fuel bunker capacity | ۲۱ | ۱۵۸ | سازمان ملل متحد | National جیپی-۵ bunker capacity of 850,000 tonnes | ۲۰۰۵ |
| Traffic related deaths per capita | ۱۱ | جهان | فهرست کشورهای جهان بر پایه قربانیان ناشی از تصادف / Smeed's law / Epidemiology of motor vehicle collisions / Traffic injuries in Iran | 35.8 people per 100,000 of population die in traffic accidents سالly; Total annual deaths of 22,918 and 685,000 injured according to سازمان بهداشت جهانی report 2009;[۱۷۰][۱۷۱] Leading cause of premature death & disability in Iran; 1.3 million potential life-سالs lost annually; Male to female death ratio of 5 to 1; Most common causes: not wearing seat belt, taligating, over-speeding, wrong overtakes, not wearing helmets, rapid changing of lanes, not signalling; Property damages worth more than $18 billion per سال due to vehicle collisions;[۱۷۲][۱۷۳][۱۷۴] More info: Car accidents in Iran, Graph comparisons of Iran[پیوند مرده] & Rapid motorization & traffic injuries in Iran[پیوند مرده] & Statistical comparison of travel safety | ۲۰۰۰ |
| Number of Natural Gas Vehicles by Country | ۳ | جهان | جهانwide NGV Statistics | Iran in 2009 stood 3rd جهانwide in terms of fleet of vehicles running on سیانجی ; Figure for the end of 2009 is 1.67 million NGVs and 1,021 fueling stations; Iran is also the جهان's fastest growing NGV market[۱۷۵][۱۷۶][۱۷۷] By the end of 2010, Iran رتبهed 2nd جهانwide with 2 million NGV's (1.3 million factory built NGV's & 0.7 million converted NGV's) as well as 1,546 operational fueling stations with a cumulative CNG production capacity of 1.5 million cubic meters/hour of CNG; Number of fueling stations is to be increased to 2,500[۱۷۸] and the number of NGV's is expected to reach 3 million by 2012[۱۷۹] | ۲۰۰۹ |
پانویس[ویرایش]
- §.^ The surveys producing these جهان رتبهها have been done in different times and might not be current. Please refer to the specific articles or منبعs for updated information, where available. Furthermore in most surveys only the important countries in the respective fields have been surveyed, thus the رتبهs might not be از بین the whole جهان and all the countries. It should also be noted that the رتبهها are based on surveys by numerous entities with different benchmarks and standards, thus caution is needed in their interpretation of final results specially in the case of subjective field matters, as some of these رتبهها maybe based on speculative, biased, subjective or politicized evaluations. Finally, it is always important to consider trend when making comparisons, since single point data may be exceptional in nature (e.g. Iran's 2008 drought and wheat production).
جستارهای وابسته[ویرایش]
- فهرست آماری ترینهای کشورها
- List of statistically superlative objects by country
- فهرستها بر پایه کشور
- Lists of countries and territories
- فهرست برترینهای آماری ایران در جهان
منابع[ویرایش]
- ↑ "Permanent crops (per capita) (most recent) by country". Nationmaster.com. Archived from the original on 30 April 2011. Retrieved 2010-12-22.
- ↑ "Arable Land hectares (most recent) by country". Nationmaster.com. 2010-02-13. Retrieved 2010-12-22.
- ↑ "UNESCO Presentation". Google.com.pk. Archived from the original on 20 March 2009. Retrieved 2010-12-22.
- ↑ "شبکه خبر :: 65 درصد جمعیت ایران تحت پوشش تلویزیون دیجیتالی". Irinn.ir. Archived from the original on 5 April 2014. Retrieved 2010-12-22.
- ↑ "Iran رتبهs 32nd in world in terms of number of websites". Payvand.com. 2006-11-22. Archived from the original on 22 December 2017. Retrieved 2010-12-22.
- ↑ «نسخه آرشیو شده» (PDF). بایگانیشده (PDF) از روی نسخه اصلی در ۱۰ اکتبر ۲۰۰۶. دریافتشده در ۱۰ اکتبر ۲۰۰۶.
- ↑ http://www.sid.ir/en/VEWSSID/J_pdf/88120090308.pdf
- ↑ «نسخه آرشیو شده» (PDF). بایگانیشده از اصلی (PDF) در ۲۲ ژوئیه ۲۰۱۱. دریافتشده در ۱۳ نوامبر ۲۰۱۱.
- ↑ "Iran, world, political, sport, economic news and headlines". MehrNews.com. Archived from the original on 13 October 2012. Retrieved 2010-12-22.
- ↑ ۱۰٫۰ ۱۰٫۱ ۱۰٫۲ ۱۰٫۳ ۱۰٫۴ ۱۰٫۵ ۱۰٫۶ ۱۰٫۷ «نسخه آرشیو شده» (PDF). بایگانیشده از اصلی (PDF) در ۲۶ مه ۲۰۱۰. دریافتشده در ۲۶ مه ۲۰۱۰.
- ↑ Rogers, Simon (2010-04-12). "Maternal mortality: how many women die in childbirth in your country? | News | guardian.co.uk". London: Guardian. Retrieved 2010-12-22.
- ↑ ۱۲٫۰ ۱۲٫۱ «A Holistic Approach Underpins the Islamic Republic of Iran's Success in Family Planning - UNFPA in Iran». بایگانیشده از اصلی در ۲۶ ژوئیه ۲۰۱۱. دریافتشده در ۱۳ نوامبر ۲۰۱۱.
- ↑ «Demografic Snapshot - UNFPA in Iran». بایگانیشده از اصلی در ۲۸ ژوئیه ۲۰۱۱. دریافتشده در ۱۳ نوامبر ۲۰۱۱.
- ↑ "Iran's Model Fertility Program". Mnforsustain.org. Archived from the original on 25 April 2017. Retrieved 2010-12-22.
- ↑ "Iran, Islamic Republic of - Statistics". UNICEF. Archived from the original on 1 January 2011. Retrieved 2010-12-22.
- ↑ «untitled» (PDF). بایگانیشده از اصلی (PDF) در ۲۲ نوامبر ۲۰۰۸. دریافتشده در ۲۲ نوامبر ۲۰۰۸.
- ↑ "Virginia Polytechnic Institute and State University Paper" (PDF). Archived from Illinois csame the original on 4 March 2016. Retrieved 13 November 2011.
{{cite web}}: Check|url=value (help) - ↑ "Virginia Polytechnic Institute and State University Paper" (PDF). Archived from the original (PDF) on 19 July 2011. Retrieved 13 November 2011.
- ↑ "Iran - Location and size, Population, Infrastructure, power, and communications, Transportation". Nationsencyclopedia.com. 2010-01-06. Retrieved 2010-12-22.
- ↑ "Islamic Republic of Iran and the Issue of Refugees". Iran Review. 2010-08-19. Archived from the original on 3 April 2020. Retrieved 2010-12-22.
- ↑ "IRAN: Iraqi refugees use new border crossing". Payvand.com. 2004-07-05. Archived from the original on 27 October 2018. Retrieved 2010-12-22.
- ↑ "Refugees in Iran and International Security". Allacademic.com. Archived from the original on 3 April 2020. Retrieved 2010-12-22.
- ↑ Atousa Bahmani. "International Consortium for Refugees in Iran". Icri-ir.com. Archived from the original on 24 July 2008. Retrieved 2010-12-22.
- ↑ "آماری از تعداد پناهندگان افغانی در ایران". Tabnak.ir. Retrieved 2010-12-22.
- ↑ http://hdr.undp.org/en/media/HDR_2009_EN_Complete.pdf
- ↑ "No Operation". Presstv.com. Archived from the original on 6 June 2012. Retrieved 2010-12-22.
- ↑ «نسخه آرشیو شده» (PDF). بایگانیشده از اصلی (PDF) در ۲۶ اکتبر ۲۰۰۴. دریافتشده در ۲۶ اکتبر ۲۰۰۴.
- ↑ ۲۸٫۰ ۲۸٫۱ ۲۸٫۲ «نسخه آرشیو شده» (PDF). بایگانیشده از اصلی (PDF) در ۱۱ ژوئن ۲۰۰۹. دریافتشده در ۱۱ ژوئن ۲۰۰۹.
- ↑ "Iran's GDP at $411B; up $44B: Economist". Payvand.com. 2006-11-22. Archived from the original on 29 June 2011. Retrieved 2010-12-22.
- ↑ "EIU: Iran's GDP to increase by $44 bln in 2010 | Economy & Business news |". En.trend.az. 2010-11-27. Archived from the original on 21 September 2012. Retrieved 2010-12-22.
- ↑ "Iran's GDP up $44b: Economist". Tehran times. 2010-11-28. Retrieved 2010-12-22.
- ↑ [۱][پیوند مرده]
- ↑ Price Interest Point (۲۰۲۳-۰۲-۱۱). «منظور از پیپ (Pip) در بازارهای بینالمللی چیست؟». khanesarmaye. دریافتشده در ۲۰۲۳-۰۷-۱۸.
- ↑ "IMF Regional Report 2010" (PDF). Retrieved 2010-12-22.
- ↑ Akbar, Ali (2010-03-10). "Fighting intensifies in Iran over subsidy cuts". BusinessWeek. Retrieved 2010-12-22.
- ↑ tehran times : Iran رتبهs 6th in attracting foreign investments
- ↑ "UNDP Iran and the MDGs". Undp.org.ir. 2010-09-22. Archived from the original on 6 January 2011. Retrieved 2010-12-22.
- ↑ August 05, 2008 — (2008-08-05). "Has Poverty Increased in Iran Under Ahmadinejad? - Brookings Institution". Brookings.edu. Retrieved 2010-12-22.
- ↑ "Myths about Iran's economy " Tyranny of numbers". Djavad.wordpress.com. 2009-03-26. Retrieved 2010-12-22.
- ↑ Post a Job (2010-07-26). "Tehran Exchange Trades Futures to Attract Investors". BusinessWeek. Retrieved 2010-12-22.