List of the wettest tropical cyclones by country

A map of all tropical cyclone tracks, encompassing the period between the years 1985 and 2005.

This is a list of wettest tropical cyclones by country, using all known available sources. Data is most complete for Australia, Cuba, Dominican Republic, Japan, Hong Kong, Mexico, Taiwan, Micronesia's Yap and Chuuk, and the United States, with fragmentary data available for other countries. The French region of Réunion holds several world records for tropical cyclone and worldwide rainfall, due to the rough topography and its location in the Indian Ocean.[1]

Antigua and Barbuda[edit]

Hurricane Earl (2010)
Wettest tropical cyclones and their remnants in Antigua and Barbuda
Highest-known totals
Precipitation Storm Location Ref.
Rank mm in
1 465.3 18.32 Lenny 1999 V. C. Bird International Airport [2]
2 252.5 9.94 Luis 1995 V. C. Bird International Airport [3]
3 245.8 9.68 Frederic 1979 V. C. Bird International Airport [3]
4 232.6 9.16 Omar 2008 V. C. Bird International Airport [3]
5 198.3 7.81 Earl 2010 V. C. Bird International Airport [3]
6 194.1 7.64 Jose 1999 V. C. Bird International Airport [3]
7 188.9 7.44 Hugo 1989 V. C. Bird International Airport [3]
8 163.6 6.44 Daisy 1962 V. C. Bird International Airport [3]
9 159.2 6.27 Iris 1995 V. C. Bird International Airport [3]
10 146.9 5.78 Rafael 2012 V. C. Bird International Airport [3]

Australia[edit]

Cyclone Jasper
Wettest tropical cyclones and their remnants in Australia
Highest-known totals
Precipitation Storm Location Ref.
Rank mm in
1 2,252 88.66 Jasper 2023 Bairds [4]
2 1,947 76.65 Peter 1979 Mount Bellenden Ker [5]
3 1,870 73.62 Rona 1999 Mount Bellenden Ker [5]
4 1,318 51.89 Wanda 1974 Mount Glorious [6]
5 1,256.8 49.48 Fletcher 2014 Kowanyama [7][8]
6 1,082 42.60 Aivu 1989 Dalrymple Heights [9]
7 1,065 41.93 May 1998 Burketown [10]
8 1,000 39.37 Justin 1997 Willis Island [11]
9 1,000 39.37 Ellie 2009 [12]
10 1,000 39.37 Oswald 2013 Tully [13]

Christmas Island[edit]

Cyclone Gillian

Christmas Island is an Australian territory located in the Indian Ocean located at the summit of a submarine mountain, which rises steeply to a central plateau that is dominated by stands of rainforest.[14] After rainfall and wind observations started on the island during 1972, only 13 tropical cyclones passed within 220 km (135 mi) of the territory between 1972 and 2005.[14]

Wettest tropical cyclones and their remnants on Christmas Island
Highest-known totals
Precipitation Storm Location Ref.
Rank mm in
1 368.2 14.5 Dahlia 2017 Christmas Island Airport [15]
2 220.2 8.67 Paddy 2021 Christmas Island Aero [16]
3 181.0 7.13 Gillian 2014 Christmas Island Airport [17]
4 115.6 4.55 Odette 2021 Christmas Island Airport [18]
5 102.4 4.03 Jacob 2007 Christmas Island Airport [19]
6 65.0 2.56 Cecily 1973 [20]
7 52.8 2.08 Rosie 2008 Christmas Island Airport [21]
8 38 1.50 Norah 1974 [22]
9 17 0.67 Denise 1975 [23]

Cocos Islands[edit]

Although Tropical Low 11U in 2013 remained more than 120 km (75 mi) away from the Cocos Islands, wind shear displaced convection westward and over the islands for several days, resulting in record breaking rainfall.[24]

The Cocos (Keeling) Islands are an Australian territory of 27 coral islands that are formed into two large coral atolls and cover an area of around 36 km2 (14 sq mi) of the Indian Ocean to the northwest of Perth, Australia.[14] Rainfall observations started on the islands during 1907, while temperature, wind and other records started in 1952.[14] Between 1952 and 2005 27 tropical cyclones caused storm force wind gusts of over 90 km/h (55 mph) on the islands, while only four caused hurricane-force gusts of over 125 km/h (80 mph).[14]

Wettest tropical cyclones and their remnants in the Cocos Islands
Highest-known totals
Precipitation Storm Location Ref.
Rank mm in
1 844.6 33.25 11U 2013 Cocos Island Airport [24]
2 298.0 11.73 Pedro 1989 [14]
3 170.0 6.69 Walter 2001 [25]
4 160.0 6.30 Adeline-Juliet 2005 [26]
5 127.0 5.00 Deidre-Dalida 1973 [27]
6 115.0 4.53 Bruce 2013 Cocos Island Airport [28][29]
7 107.6 4.24 Kate 2014 Cocos Island Airport [30][31]
8 89.4 3.52 Norah 1974 [22]
9 66.9 2.63 Annie 1973 [32]
10 56.0 2.20 Anggrek 2010 Cocos Island Airport [33]

Bahamas[edit]

Tropical Storm Noel over the Bahamas
Wettest tropical cyclones and their remnants in the Bahamas
Highest-known totals
Precipitation Storm Location Ref.
Rank mm in
1 747.5 29.43 Noel 2007 Long Island [34]
2 580.1 22.84 Dorian 2019 Hope Town [35]
3 500.3 19.70 Matthew 2016 Matthew Town, Inagua [36]
4 436.6 17.19 Flora 1963 Duncan Town [37]
5 390.1 15.36 Inez 1966 Nassau Airport [37]
6 337.1 13.27 Fox 1952 New Providence [37]
7 321.1 12.64 Michelle 2001 Nassau [38]
8 309.4 12.18 Erin 1995 Church Grove [39]
9 260.0 9.88 Fay 2008 Freeport [40]
10 236.7 9.32 Floyd 1999 Little Harbor Abacos [41]

Bangladesh[edit]

Cyclone Komen approaching Bangladesh on July 29, 2015

Bangladesh has been the scene of the greatest tropical cyclone casualties in recent times. The country is quite flat and generally lies near sea level.

Wettest tropical cyclones and their remnants in Bangladesh
Highest-known totals
Precipitation Storm Location Ref.
Rank mm in
1 1,051.2 41.39 Komen 2015 Chittagong [42]
2 ~300 ~12.00 Rashmi 2008 [43]
3 280 11.02 Monsoon Depression — Sep. 2004 Barisal [44]
4 253 10.00 Viyaru 2013 Patuakhali [45]
5 227.2 8.94 Trop. Depression — Oct. 2004 Rangpur [46]
6 220.0 8.66 Bhola 1970 Maya Bandar [47]
7 200 7.87 Sidr 2007 [48]
8 130 5.11 Aila 2009 Chittagong [49]
9 129 5.07 Bijli 2009 [50]
10 53 2.13 Akash 2007 [51]

Belize[edit]

This country has terrain mainly across its southern sections, with elevations up to about 3,700 feet (1,100 m).[52] The highest reported rainfall in what was formerly British Honduras occurred during Hurricane Keith in 2000 when 32.67 inches (830 mm) of rain fell in a 24‑hour period at Phillip Goodson International Airport in Belize City.[53] Equally heavy rains could have fallen during Hurricane Hattie of 1961 and Hurricane Fifi of 1974.

Hurricane Keith (2000)
Wettest tropical cyclones and their remnants in Belize
Highest-known totals
Precipitation Storm Location Ref.
Rank mm in
1 829.8 32.67 Keith 2000 Philip Goldson Airport [54]
2 555.2 21.86 Eta 2020 Baldy Beacon [55]
3 546.6 21.52 Sixteen 2008 Baldy Beacon [56]
4 299.7 11.80 Amanda 2020 Belmopan [57]
5 249.2 9.81 Chantal 2001 Towerhill [58]
6 246.0 9.69 Mitch 1998 Central Farm Meteorological Station [59]
7 241.0 9.49 Gert 1993 Hunting Caye [60]
8 179.0 7.05 Greta 1978 Central Farm Meteorological Station [59]
9 152.4 6.00 Fifi 1974 La Placencia [61]
10 131.0 5.16 Hermine 1980 Central Farm Meteorological Station [59]

Cambodia[edit]

Typhoon Linda (1997)
Wettest tropical cyclones and their remnants in Cambodia
Highest-known totals
Precipitation Storm Location Ref.
Rank mm in
1 404.1 15.91 Linda 1997 Kompot [62]
2 240.0 9.45 Violet 1964 Paksa [63]
3 30.5 1.20 Faith 1998 Kompong Cham [64]

Canada[edit]

Extratropical cyclone Harvey near Nova Scotia

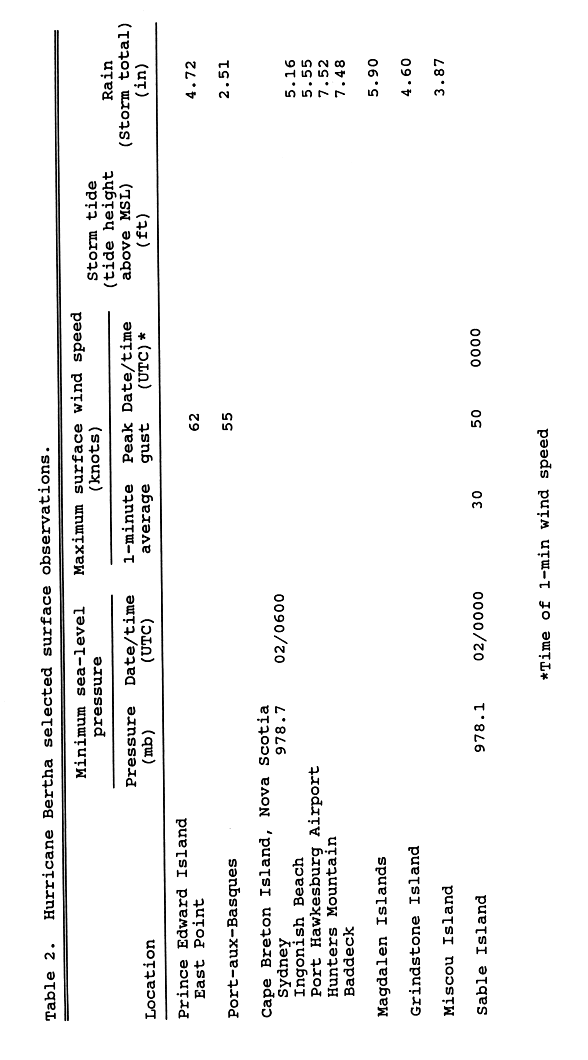
Tropical cyclones are usually in transition to extratropical cyclones by the time they reach Atlantic Canada, though occasionally they retain their tropical status. No tropical cyclone has ever hit Canada's Pacific coast.

Wettest tropical cyclones and their remnants in Canada
Highest-known totals
Precipitation Storm Location Ref.
Rank mm in
1 302.0 11.89 Harvey 1999 Oxford, NS [65]
2 249.9 9.84 Beth 1971 Halifax, NS [66]
3 238.0 9.37 Igor 2010 St. Lawrence, NL [67]
4 224.8 8.85 Matthew 2016 Sydney, NS [68]
5 213.6 8.41 Hazel 1954 Snelgrove, ON [69]
6 212.0 8.35 Fiona 2022 Cape North, NS [70]
7 210.0 8.26 Earl 2022 Paradise, NL [71]
8 191.0 7.52 Bertha 1990 Hunter's Mountain, NS [72]
9 185.0 7.28 Sandy 2012 Charlevoix, QC [73]
10 175.0 6.90 Gabrielle 2001 St. John's, NL [74]

China[edit]

China is a mountainous country, which leads to rapid dissipation of cyclones that move inland as well as significant amounts of rain from those dissipating cyclones. Typhoon Nina (1975) caused the collapse of two huge reservoirs and ten smaller dams when 1,062 millimetres (41.8 in) fell in Henan during a 24‑hour period, which is the record for Mainland China. Typhoon Sam of the 1999 Pacific typhoon season became the wettest known tropical cyclone to impact Hong Kong since records began in 1884, breaking a 73‑year‑old record.[75] Precipitation associated with tropical cyclones and their remains can bring snow to Tibet. An early October 2004 tropical depression brought daily precipitation of 6 centimetres (2.4 in) of liquid equivalent precipitation to Che-Ku county in the form of heavy snow, which was a new October daily precipitation record for both rain and snow. This led to a loss of 340,000 kg of food, 230,000 kg of forage grass, and 263 livestock in the snowstorm.[76]

Mainland[edit]

Typhoon In-fa
Wettest tropical cyclones and their remnants in Mainland China
Highest-known totals
Precipitation Storm Location Ref.
Rank mm in
1 1629.0 64.13 Nina 1975 Banqiao Dam [77]
2 951.0 37.4 In-fa 2021 Yuyao [78]
3 831.1 32.72 Fitow 2001 Changjiang County [79]
4 806.0 31.73 Soudelor 2015 Wenzhou [80]
5 744.8 29.32 Doksuri 2023 Wangjiayuan Reservoir [81][82]
6 662.0 26.01 Chanthu 2021 Dinghai District, Zhoushan [83]
7 600.0 24.00 Haikui 2012 Anhui Province [84]
8 555.0 21.85 Chanchu 2006 Zhangpu County [85]

Hong Kong[edit]

Typhoon Sam
Wettest tropical cyclones and their remnants Hong Kong
Highest-known totals
Precipitation Storm Location Ref.
Rank mm in
1 632.0 24.90 Haikui 2023 Hong Kong Observatory [86]
2 616.5 24.27 Sam 1999 Hong Kong Observatory [86]
3 597.0 23.50 July 1926 Typhoon Royal Observatory, Hong Kong [86]
4 562.0 22.13 June 1916 Typhoon Royal Observatory, Hong Kong [86]
5 530.7 20.89 Agnes 1965 Royal Observatory, Hong Kong [86]
6 519.0 20.43 Agnes 1978 Royal Observatory, Hong Kong [86]
7 516.1 20.32 Ellen 1976 Royal Observatory, Hong Kong [86]
8 497.5 19.59 Dot 1993 Royal Observatory, Hong Kong [86]
9 491.7 19.36 Dot 1982 Royal Observatory, Hong Kong [86]
10 480.9 18.93 Helen 1995 Royal Observatory, Hong Kong [86]

Costa Rica[edit]

Hurricane Cesar
Wettest tropical cyclones and their remnants in Costa Rica
Highest-known totals
Precipitation Storm Location Ref.
Rank mm in
1 920.0 36.22 Cesar 1996 Alto de Tinamaste [87]
2 624.4 24.58 Eta 2020 Arunachala [55]
3 487.4 19.19 Nate 2017 Maritima [88]
4 466.6 18.37 Mitch 1998 Jaco [89]
5 376.4 14.82 Alma 2008 Quepos [90]
6 331.5 13.05 Gert 1993 Unknown [91]
7 308.0 12.11 Otto 2016 Miravalles Volcano [92]

Cuba[edit]

Hurricane Flora of October 1963 drifted across Cuba for four days, leading to extreme rainfall across the mountainous island country. During the heaviest 24‑hour period of rainfall, 735 millimetres (28.9 in) of rain fell at Santiago de Cuba. Total amounts of 2,033 millimetres (80.0 in) over 4 days and 2,550 millimetres (100 in) over 5 days produced staggering loss of life in Cuba, where over 2000 perished.[93]

Hurricane Dennis
Wettest tropical cyclones and their remnants in Cuba
Highest-known totals
Precipitation Storm Location Ref.
Rank mm in
1 2,550 100.39 Flora 1963 [93]
2 1,092 42.99 Dennis 2005 [93]
3 1,025 40.35 T.D. #1 1988 [93]
4 1,012 39.84 Alberto 1982 [93]
5 870 34.25 Frederic 1979 [93]
6 849 33.43 T.D. #1 1992 [93]
7 825 32.48 Laura 1971 [93]
8 800 31.50 Irene 1999 [93]
9 754 29.69 Michelle 2001 [93]
10 747 29.41 Lili 1996 [93]

Dominica[edit]

Erika near Dominica

The islands of the eastern Caribbean are constantly threatened by tropical storms and hurricanes, mainly between August and October. Dominica is a rugged island, with spots of elevation as high as nearly 4,750 feet (1,450 m).[94] As Hurricane Jeanne moved through the region, 422.3 millimetres (16.63 in) of rain fell during the 24‑hour period ending on the morning of September 15, 2004.[95]

Wettest tropical cyclones and their remnants in Dominica
Highest-known totals
Precipitation Storm Location Ref.
Rank mm in
1 800–850 31–33 Erika 2015 Morne Diablotins [96]
2 579.1 22.80 Maria 2017 Cophall [97]
3 422.3 16.63 Jeanne 2004 [95]
4 246.4 9.70 Edith 1963 [37]
5 215.9 8.50 David 1979 Roseau [98]
6 150.1 5.91 Abby 1960 [99]
7 79.5 3.13 Isaias 2020 Salisbury [37]
8 20.6 0.81 Flora 1963 [37]

Dominican Republic[edit]

Noel near Dominican Republic

The Dominican Republic, has some of the highest terrain surrounding the Caribbean Sea, with Pico Duarte peaking at 10,700 feet (3,300 m) above sea level.[100] Most of the tropical cyclone rainfall totals on the list below are 24‑hour maxima, which likely underrepresent the storm total.

Wettest tropical cyclones and their remnants the Dominican Republic
Highest-known totals
Precipitation Storm Location Ref.
Rank mm in
1 1001.5 39.43 Flora 1963 Polo Barahona [37]
2 905.0 35.63 Noel 2007 Angelina [101]
3 598.0 23.54 Cleo 1964 Polo [37]
4 528.0 20.79 Emily 2011 Neyba [102]
5 505.2 19.89 Jeanne 2004 Isla Saona [103]
6 479.8 18.89 Inez 1966 Polo [104]
7 445.5 17.54 Hurricane Four 1944 Hondo Valle [105]
8 391.4 15.41 Hurricane Five 1935 Barahona [106]
9 359.9 14.17 Hanna 2008 Oveido [107]
10 350.0 13.78 T.S. One 1948 Bayaguana [108]

El Salvador[edit]

Tropical Depression Twelve-E (2011)
Wettest tropical cyclones and their remnants in El Salvador
Highest-known totals
Precipitation Storm Location Ref.
Rank mm in
1 1513 59.57 Twelve E (2011) Huizucar, La Libertad [109][110][111]
2 1.017 40.03 Amanda 2020 [112]
3 861 33.90 Mitch 1998 [110]
4 766 30.16 Stan 2005 [110]
5 676 26.61 Paul 1982 [110]
6 672 26.46 Agatha 2010 [113]
7 603 23.74 Matthew 2010 [110]
8 275.4 10.84 Eta 2020 Planes de Montecristo [55]

Fiji[edit]

Cyclone Wally

Orography from the volcanic islands of Fiji has led to significant rainfall during tropical cyclone passages, which occur roughly once a year.

Wettest tropical cyclones and their remnants in Fiji
Highest-known totals
Precipitation Storm Location Ref.
Rank mm in
1 1,139 44.84 Wally (1980) Sakisa [114]
2 1,040 40.94 Kina (1992-93) Monasavu dam [115]
3 913 35.94 04F (2016) Monasavu dam [116]
4 755 29.72 Bebe (1972) Naseuvou [117]
5 744 29.29 Ana (2021) Dreketilailai [118]
6 697 27.44 Gavin (1985) Monasavu dam [119]
7 615 24.21 Gavin (1997) Monasavu dam [120]
8 545 21.46 June (1997) Matei [121]
9 535 21.06 14F (2016) Nadarivatu [122]
10 529 20.83 Evan (2012) Monasavu dam [123]

France[edit]

French Polynesia[edit]

Cyclone Wasa
Wettest tropical cyclones and their remnants in French Polynesia
Highest-known totals
Precipitation Storm Location Ref.
Rank mm in
1 550 21.65 02F 1998 Tahiti [124]
2 356 14.02 Judy 2004 Takaroa [125]
3 241 9.49 Wasa 1991 Uturoa [126]
4 149 5.87 Pam 1997 Rarotonga [127]
5 62.1 2.44 Zita 2007 Rurutu [128]

Guadeloupe[edit]

Hurricane Marilyn moved directly across the island in mid-September 1995,[129] bringing the highest known rainfall totals to the island from a tropical cyclone.

Hurricane Luis
Wettest tropical cyclones and their remnants in Guadeloupe
Highest-known totals
Precipitation Storm Location Ref.
Rank mm in
1 582 22.91 Luis 1995 Dent de l'est (Soufrière)
2 534 21.02 Fiona 2022 Saint-Claude [130]
3 508 20.00 Marilyn 1995 Saint-Claude [37]
4 466 18.35 Lenny 1999 Gendarmerie [131]
5 389 15.31 Hugo 1989
6 318 12.52 Hortense 1996 Maison du Volcan [132]
7 300 11.81 Jeanne 2004 [133]
8 223.3 8.79 Cleo 1964 Deshaies [37]
9 200 7.87 Erika 2009 [134]
10 165.3 6.51 Earl 2010 Sainte-Rose (Viard) [135]

Martinique[edit]

Martinique is a mountainous island at the fringe of the eastern Caribbean Sea.

Wettest tropical cyclones and their remnants in Martinique
Highest-known totals
Precipitation Storm Location Ref.
Rank mm in
1 680.7 26.80 Dorothy 1970 Fourniols [136]
2 567.0 22.32 Klaus 1990 Le Morne-Rouge [137]
3 475.0 18.07 Beulah 1967 Les Anses-d'Arlets [138]
4 450.1 17.72 Iris 1995 Ducos [139]
5 349.0 13.74 David 1979 Saint-Joseph [140]
6 332.0 13.07 Dean 2007 Fort-de-France [141]
7 305.0 12.01 Cindy 1993 Le Prêcheur [142]
8 301.5 11.87 Edith 1963 Saint-Pierre [37]
9 280.0 11.02 Allen 1980 Grand-Rivière [143]
10 230.1 9.059 Marilyn 1995 Le Morne-Rouge [144]
Tropical Storm Dorothy (1970)

New Caledonia[edit]

Cyclone Gyan
Wettest tropical cyclones and their remnants in New Caledonia
Highest-known totals
Precipitation Storm Location Ref.
Rank mm in
1 813 32.01 Gyan 1981 La Ouinné [145]
2 750 29.53 Beatrice 1959 Tiwaka [145]
3 713 28.07 Anne 1988 Goro [145]
4 620 24.41 Unnamed 1962 Houaïlou [145]
5 528 20.79 Esau 1992 Kopéto [145]
6 474 18.66 Drena 1997 Dzumac [145]
7 450 17.72 Vania 2011 Goro (Station Vale NC) [145]
8 414 16.30 Frank 1999 Tango (Chaîne) [145]
9 411 16.18 Cliff 1981 La Ouinné [145]
10 409 16.10 Cook 2017 Thio-Plateau [146]

Réunion Island[edit]

Cyclone Hyacinthe.

The mountainous island of Réunion has experienced several of the highest rainfall totals on record from tropical cyclones and holds the rainfall world records for 12, 24, 48, 72 hours, four, five, six, seven, eight, nine and ten days as a result.[147][148][149] The 12 and 24 hourly rainfall records were set at Foc-Foc by Cyclone Denise in 1966, while an Unnamed Tropical Cyclone between April 8–10, 1958 set the record for 48 hours at Aurere. Tropical Cyclone Gamede between February 24–28, 2007 came close to beating the records for 12, 24 and 48 hours before setting the records for three, four, five, six, seven, eight and nine days that were held by Tropical Cyclone Hyacinthe 1980.[148][149] Hyacinthe 1980 currently holds the world records for ten and fifteen days with rainfall totals of 5,678 millimetres (223.5 in) and 6,083 millimetres (239.5 in) respectively recorded at Commerson Crater.[149][150]

Wettest tropical cyclones and their remnants on Reunion island
Highest-known totals
Precipitation Storm Location Ref.
Rank mm in
1 6,433 253.27 Hyacinthe 1980 Commerson [149]
2 5,512 217.01 Gamede 2007 Commerson [148]
3 2,958 116.46 Diwa 2006 Grand-Ilet [148]
4 2,044 80.472 Batsirai 2022 Commerson [151]
5 1,825 71.85 Denise 1966 Foc-Foc [149]
6 1,360 53.54 Dina 2002 Bellecombe [152]
7 1,309 51.54 Firinga 1989 Pas de Bellecombe [153]
8 1,196 47.09 Gael 2009 Commerson [154]
9 1,196 47.09 Florine 1981 Foc-Foc [155]
10 1,025 40.35 Bejisa 2013 Cilaos [156]

Saint Martin[edit]

Hurricane Lenny
Wettest tropical cyclones and their remnants in Saint Martin
Highest-known totals
Precipitation Storm Location Ref.
Rank mm in
1 866.6 34.12 Lenny 1999 Gendarmerie [2]
2 349.3 13.75 Jose 1999 Point Blanche [157]
3 328.7 12.94 Otto 2010 Charlotte Amalie [158]
4 98.0 3.86 Earl 2010 Grand Case [159]
6 85.1 3.35 Marilyn 1995 [160]

Wallis and Futuna[edit]

Cyclone Fran
Wettest tropical cyclones and their remnants in Wallis and Futuna
Highest-known totals
Precipitation Storm Location Ref.
Rank mm in
1 674.9 26.57 Raja 1986 Maopoopo, Futuna Island [161]
2 556.7 21.92 Fran 1992 Hihifo, Wallis Island [161]
3 291.2 11.46 Val 1975 Hihifo, Wallis Island [161]
4 220.6 8.69 Hina 1997 Maopoopo, Futuna Island [161]
5 186.0 7.32 Evan 2012 Futuna Island [161]
6 180.0 7.09 Val 1980 Maopoopo, Futuna Island [161]
7 171.6 6.76 Keli 1997 Hihifo, Wallis Island [161]
8 160.8 6.33 Unnamed 1966 Malaetoli, Wallis Island [161]
9 160.0 6.30 Amos 2016 Hihifo, Wallis Island [162]
10 119.0 4.69 Waka 2001 Hihifo, Wallis Island [161]

Guatemala[edit]

Tropical Storm Agatha in May 2010 became the second-wettest tropical cyclone in the nation's history when it slowly developed while remaining nearly stationary to the southwest of Guatemala, before turning northeast and dissipating across inland Central America.[163]

Tropical Storm Agatha (2010)
Wettest tropical cyclones and their remnants Guatemala
Highest-known totals
Precipitation Storm Location Ref.
Rank mm in
1 600 23.62 Mitch 1998 Central Sierra de las Minas [164]
2 565.6 22.62 Agatha 2010 Mazatenango [165]
3 534.8 21.06 Eta 2020 Cobán [55]
4 299.7 11.8 Amanda 2020 Jutiapa [57]
5 ~250 ~9.84 Stan 2005 [166]
6 ~200 ~7.87 Adrian 2005 [167]
7 184.6 7.27 Francelia 1969 [168]

Haiti[edit]

Haiti that makes up three-eighths of Hispaniola,[169][170] is a mountainous country that has experienced some of the most powerful hurricanes on record, including Hurricane David. Its three mountain ranges have peaks as high as 8793 feet/2680 meters above sea level.[171]

Hurricane Flora
Wettest tropical cyclones and their remnants in Haiti
Highest-known totals
Precipitation Storm Location Ref.
Rank mm in
1 1,447.8 57.00 Flora 1963 Miragoâne [172]
2 654.8 25.78 Noel 2007 Camp Perrin [173]
3 604.5 23.80 Matthew 2016 Anse-á-Veau [174]
4 410.0 16.14 Lili 2002 Camp Perrin [175]
5 323.0 12.72 Hanna 2008 Camp Perrin [176]
6 273.0 10.75 Gustav 2008 Camp Perrin [177]
7 168.0 6.614 Laura 2020 Port-Au-Prince [178]
8 65.0 2.56 Fox 1952 Ouanaminthe [37]

Honduras[edit]

Hurricane Mitch
Wettest tropical cyclones and their remnants Honduras
Highest-known totals
Precipitation Storm Location Ref.
Rank mm in
1 912 35.89 Mitch 1998 Choluteca [179]
2 803 31.63 Eta 2020 Tela, Atlántida [55]
3 760 29.92 Alma 1966 San Rafael [180]
4 610 24.00 Fifi 1974 [181]
5 554 21.82 Beta 2005 Trujillo [182]
6 360 14.19 T.D. #16 2008 Roatán [183]
7 301 11.85 Iota 2020 La Ceiba [184]
8 244 9.62 Felix 2007 Omoa [185]
9 192 7.56 Nana 2020 Roatan [186]
10 172 6.77 Gert 1993 Tegucigalpa [187]

Swan Island[edit]

Hurricane Alma (1966)
Wettest tropical cyclones and their remnants on Swan Island
Highest-known totals
Precipitation Storm Location Ref.
Rank mm in
1 362.7 14.28 Alma 1966 [37]
2 228.9 9.01 Debbie 1965 [37]
3 220.0 8.66 Ella 1970 [37]
4 178.6 7.03 Laurie 1969 [37]
5 167.1 6.58 Isbell 1964 [37]
6 105.2 4.14 Beulah 1967 [37]
7 98.8 3.89 Carla 1961 [37]
8 90.7 3.57 Francelia 1969 [37]
9 87.1 3.43 Hattie 1961 [37]
10 80.5 3.17 Fox 1952 [37]

India[edit]

Cyclone Nisha

India can be struck by cyclones that form in the Bay of Bengal or the Arabian Sea.

Wettest tropical cyclones and their remnants in India
Highest-known totals
Precipitation Storm Location Ref.
Rank mm in
1 2,300 90.55 1968 Severe Cyclonic Storm Pedong, West Bengal [188]
2 1,840 72.44 Severe Cyclonic Storm ARB 01 (2004) Aminidivi, Lakshadweep [189]
3 1,340 52.76 Depression Six (1961) Cherrapunji, Meghalaya [190]
4 1280 50.39 Nisha (2008) Orathanadu, Tamil Nadu [191][192][193]
5 1171 46.10 Phyan (2009) Kethi, Tamil Nadu [194]
6 1030 40.55 Ogni (2006) Avanigadda, Andhra Pradesh [195]
7 953 37.52 1943 Severe Cyclonic Storm Cuddalore, Tamil Nadu [196]
8 910 35.83 Deep Depression Four (1963) Cherrapunji, Meghalaya [197]
9 810 31.89 Cyclone 12 (1959) Bano [198]
10 800 31.50 Cyclone 5 (1968) Harnai [198]

Indonesia[edit]

Cyclone Cempaka

The precursor tropical disturbance of Tropical Cyclone Inigo in April 2003 dropped heavy rainfall in eastern Indonesia. The rainfall caused flash flooding and mudslides, primarily in Flores but also on West Timor[199] and Sumba.[200] In some locations, the depth of the floodwaters reached 5 metres (16 ft). The Oessao River in West Timor exceeded its banks, which flooded seven villages. In Kupang in West Timor, the system destroyed hundreds of homes and large fields of corn, bean, and rice crop. Heavy damage was reported near Ende, where flooding and mudslides destroyed 20 houses and destroyed the roads connecting to East Flores. The city airport was flooded with one meter (3 ft) of water, preventing aerial transportation and which left the city temporarily isolated. In East Flores Regency in eastern Flores Island, the system left 75 destroyed houses, along with 77 severely damaged and a further 56 receiving light damage.[199]

Wettest tropical cyclones and their remnants in Indonesia
Highest-known totals
Precipitation Storm Location Ref.
Rank mm in
1 383 15.1 Cempaka 2017 Pacitan, East Java
2 223 8.78 Inigo 2003 Larantuka, Flores [201]
3 193 7.6 Kirrily 2009 Tual, Maluku Province [202]
4 159.7 6.29 Seroja 2021 Kalabahi, Alor Island [203]
5 148 5.8 17U 2019 Yogyakarta

Iran[edit]

Cyclone Gonu
Wettest tropical cyclones and their remnants in Iran
Highest-known totals
Precipitation Storm Location Ref.
Rank mm in
1 74 mm 2.91 inches Gonu 2007 Chabahar [204]

Jamaica[edit]

Hurricane Michelle

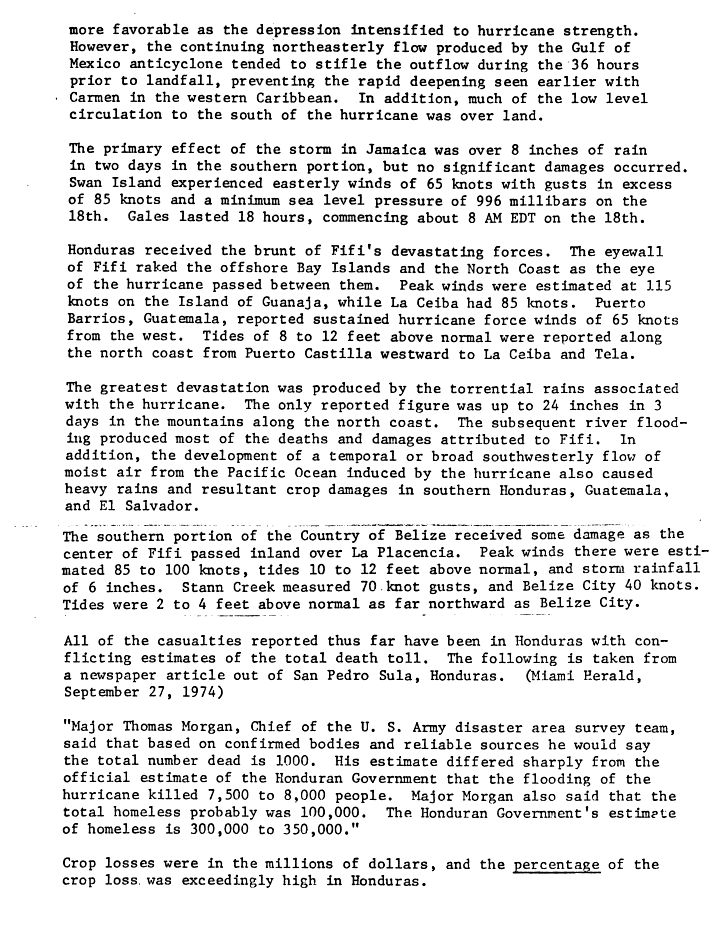
This mountainous island country of Jamaica can get lashed with rainfall by slow-moving tropical cyclones in the western Caribbean Sea. Its interior, the Blue Mountains, reach a height of 7,400 feet (2,300 m) above sea level.[205]

Wettest tropical cyclones and their remnants in Jamaica
Highest-known totals
Precipitation Storm Location Ref.
Rank mm in
1 3429.0 135.00 Nov. 1909 Hurricane Silver Hill Plantation [206]
2 1524.0 60.00 Flora 1963 Silver Hill [207]
3 1057.9 41.65 Michelle 2001 [208]
4 950.0 37.42 Nicole 2010 Negril [209]
5 938.3 36.94 Gilda 1973 Top Mountain [207]
6 863.6 34.00 June 1979 T.D. Western Jamaica [210]
7 823.0 32.40 Gilbert 1988 Interior mountains [208]
8 733.8 28.89 Eta 2020 Moore Town, Jamaica [55]
9 720.6 28.37 Ivan 2004 Ritchies [211]
10 713.5 28.09 Sandy 2012 Mill Bank [212]

Japan[edit]

Typhoon Namtheun approaching Japan on July 30, 2004

The mountainous island archipelago is constantly struck by typhoons recurving out of the tropics, which are normally in extratropical transition as they pass through Japan. Typhoon Namtheun of the 2004 Pacific typhoon season holds the national 24-hour precipitation record with 1,317 millimetres (51.9 in) observed in Kisawa village,[213] surpassing the previous record of 1,140 mm (45 in) set during Typhoon Fran in 1976.[214]

Wettest tropical cyclones and their remnants in Japan
Highest-known totals
Precipitation Storm Location Ref.
Rank mm in
1 2781.0 109.50 Fran 1976 Hiso [214]
2 >2000.0 >78.74 Namtheun 2004 Kisawa [213]
3 1805.5 71.08 Talas 2011 Kamikitayama [215]
4 1518.9 59.80 Olive 1971 Ebino [216]
5 1322.0 52.04 Nabi 2005 Mikado [217]
6 1286.0 50.62 Kent 1992 Hidegadake [218]
7 1167.0 45.94 Judy 1989 Hidegadake [219]
8 1138.0 44.80 Abby 1983 Amagisan [220]
9 1124.0 44.25 Flo 1990 Yanase [221]
10 ~1092.0 ~43.00 Trix 1971 Yangitake [222]

Okinawa[edit]

Typhoon Sinlaku near Okinawa on September 12, 2008
Wettest tropical cyclones and their remnants in Okinawa
Highest-known totals
Precipitation Storm Location Ref.
Rank mm in
1 1065.0 41.92 Sinlaku 2008 Yonagunijima [223]
2 1059.0 41.70 Emma 1956 Kadena Air Force Base [224]
3 1014.0 41.00 Muifa 2011 [225]
4 575.6 22.66 Charlotte 1959 Naha Air Force Base [37]
5 535.0 21.06 Bolaven 2012 Kunigami [226]
6 473.7 18.65 Cora 1969 Kadena Air Force Base [37]
7 452.0 17.80 Sinlaku 2002 Oku [227]
8 407.2 16.03 Grace 1961 Kadena Air Force Base [37]
9 345.0 13.50 Conson 2004 Tarama [228]
10 342.0 13.46 Kujira 2003 [229]

Ryukyu Islands[edit]

Typhoon Rusa caused 409 millimetres (16.1 in) of rain to fall at Naze on August 29–30, 2002.[230] Typhoon Aere dropped 314.5 millimetres (12.38 in) of rain in the 65‑hour period ending at 1400 UTC on August 25, 2004, at Ishigakihima.[231] Typhoon Agnes in August 1957 dropped 586.2 millimetres (23.08 in) of rainfall on Marcus Island.[37] In 1972, Typhoon Rita dumped 31.87 in (809 mm) on Okinoerabu Shima.[232]

Johnston Atoll[edit]

Tropical cyclones occasionally threaten this central Pacific island. Hurricane Celeste of 1972 brought 6.21 inches (158 mm) to the isle around August 19.[233]

Korea[edit]

The Korean Peninsula experiences typhoons regularly. Tropical cyclones which impact southern China also lead to, on average, five heavy rainfall events per year across the Korean peninsula.[234]

North Korea[edit]

Very heavy rains fell across Tongchon and Kosong counties during Typhoon Rusa in 2002, where up to 510 millimetres (20 in) of precipitation fell in a 5- to 10-hour period.[230]

South Korea[edit]

Severe Tropical Storm Nakri
Wettest tropical cyclones and their remnants in South Korea
Highest-known totals
Precipitation Storm Location Ref.
Rank mm in
1 >1,500 >59.05 Nakri 2014 Mount Halla, Jeju Island [235]
2 >1,300 >51.18 Chanthu 2021 Mount Halla, Jeju Island [236]
3 1250.5 49.23 Chan-hom 2015 Mount Halla, Jeju Island [237]
4 898.0 35.35 Rusa 2002 Gangneung [238]
5 710.0 28.00 Agnes 1981 [239]
6 660.4 26.00 Gladys 1991 [240]
7 634.0 24.96 Muifa 2011 Eorimok [241]
8 590.0 23.23 Nari 2007 Jeju [242]
9 491.0 19.33 Saomai 2000 [243]
10 374.0 14.72 Meari 2011 Boeun [244]

Madagascar[edit]

Cyclone Kesiny

The north end of the island, known as the Tsaratanana Massif region, contains terrain with elevations up to 9417 feet/2880 meters.[245]

Wettest tropical cyclones and their remnants in Madagascar
Highest-known totals
Precipitation Storm Location Ref.
Rank mm in
1 891.0 35.07 Kesiny 2002 Toamasina [246]
2 715.0 28.14 Elita 2004 [247]
3 707.0 27.8 Guillaume 2002 Toamasina [248]
4 355.2 13.9 Indlala 2007 Antalaha [249]
5 300.0 12.0 Cela 2003 [250]
6 279.4 11.0 Chanda 2012 [251]
7 261.0 10.2 Ivan 2008 Toamasina [249]
8 255.4 10.0 Gafilo 2004 Nosy-be [252]
9 237.2 9.3 Ernest 2005 Toliara [252]
10 229.0 9.0 Jade 2009 Toamasina [253]

Malaysia[edit]

Tropical Storm Jelawat/Domeng
Wettest tropical cyclones and their remnants in Malaysia
Highest-known totals
Precipitation Storm Location Ref.
Rank mm in
1 220 8.66 Jelawat/Domeng 2006 Kampung Bundu [254]

Mauritius[edit]

Cyclone Dina (2002)
Wettest tropical cyclones and their remnants in Mauritius
Highest-known totals
Precipitation Storm Location Ref.
Rank mm in
1 745.2 29.34 Dina 2002 Pierrefonds [255]
2 711 27.99 Hollanda 1994 Mare-aux-Vacoas
3 227 8.937 Davina 1999 Arnaud [256]
3 202.8 7.98 Hennie 2005 Sans-Souci
4 192.8 7.59 Dumile 2013 Arnaud [257]
5 58.8 2.31 Crystal 2002 Providence [258]

Marshall Islands[edit]

Tropical Storm Bavi
Wettest tropical cyclones and their remnants
in the Marshall Islands
Highest-known totals
Precipitation Storm Location Ref.
Rank mm in
1 271 10.65 Bavi 2015 Kwajalein Atoll [259]

Mexico[edit]

Hurricane Wilma of 2005 drifted over the northeast portion of the Yucatán peninsula for a couple of days, dropping significant rains. A report of 1,576 millimetres (62.0 in) was reported by the Servicio Meteorológico Nacional in Mexico,[260] which is the wettest known 24-hour rainfall amount ever measured in Mexico. Second on the list is from Tropical Storm Frances in 1998, which accumulated up to 1,019 millimetres (40.1 in) of rain at Independencia in southern Chiapas.[261] Below is a list of the highest known storm total rainfall amounts from individual tropical cyclones across Mexico. Most of the rainfall information was provided by the Mexico's National Weather Service, Servicio Meteorológico Nacional, which is a part of the National Water Commission, Comisión Nacional del Agua.

Hurricane Wilma

Wettest tropical cyclones and their remnants Mexico (Overall)
Highest-known totals
Precipitation Storm Location Ref.
Rank mm in
1 1576 62.05 Wilma 2005 Quintana Roo [262]
2 1119 44.06 Frances 1998 Escuintla [263]
3 1098 43.23 TD 11 (1999) Jalacingo [264]
4 1011 39.80 Juliette 2001 Cuadano/Santiago [265]
5 950 37.41 Dolly 1996 Igual [266]
6 941 37.06 Fifi–Orlene 1974 Tlanchinol [267]
7 890 35.04 Alex 2010 Monterrey [268]
8 805 31.69 Gert 1993 Aquismón [269]
9 791 31.15 Hermine 1980 San Pedro Tapanatepec [270]
10 774 30.49 Isidore 2002 Campeche [271]

Federated States of Micronesia[edit]

Chuuk[edit]

Elevations of the islands surrounding Chuuk lagoon reach a height of about 1,450 feet (440 m).[272] Typhoon Chataan led to excessive rainfall on this island from June 23 – July 3, 2002, when a total of 939 mm (37.0 in) fell. During the time frame when Chataan was declared a tropical cyclone from July 1–3, 622 mm (24.5 in) fell, with 506 mm (19.9 in) falling on the 2nd alone at the international airport.[273]

Typhoon Chataan
Wettest tropical cyclones and their remnants on Chuuk
Highest-known totals
Precipitation Storm Location Ref.
Rank mm in
1 939.0 36.96 Chataan 2002 Chuuk Int'l Airport [274]
2 447.0 17.60 Dale 1996 Chuuk WSO AP [37]
3 427.5 16.83 Sudal 2004 Chuuk WSO AP [37]
4 405.1 15.95 Andy 1989 Truk WSO Airport [37]
5 381.1 15.03 Jean 1968 Truk WSO Airport [37]
6 371.9 14.64 Karen 1962 Truk WSO Airport [37]
7 370.6 14.59 Pamela 1976 Truk WSO Airport [37]
8 344.7 13.57 Harriet 1959 Truk WSO Airport [37]
9 234.2 9.22 Kulap 2005 Chuuk WSO AP [37]
10 214.1 8.43 Pongsona 2002 Chuuk WSO AP [37]

Kosrae[edit]

Wettest tropical cyclones and their remnants in Kosrae State
Highest-known totals
Precipitation Storm Location Ref.
Rank mm in
1 509.3 20.05 Faxai 2001 Kosrae [37]
2 434.1 17.09 Phanfone 2002 Kosrae [37]

Pohnpei State[edit]

The state is mountainous island lies in the tropical northwest Pacific Ocean.

Tropical Storm Dolphin intensifying on May 10, 2015
Wettest tropical cyclones and their remnants in Pohnpei State
Highest-known totals
Precipitation Storm Location Ref.
Rank mm in
1 603 23.74 Dolphin 2015 Pohnpei
2 247 9.72 Axel 1992 [275]
3 118 4.65 Haishen 2015 Pohnpei [276]

Yap State[edit]

The wettest known tropical cyclone for the state was Ruby in 1982, which drifted in the island's vicinity for several days during its initial development phase.[277]

Typhoon Ruby (1982)
Wettest tropical cyclones and their remnants in Yap state
Highest-known totals
Precipitation Storm Location Ref.
Rank mm in
1 594.4 23.40 Ruby 1982 Yap Island WSO Airport [37]
2 390.9 15.39 Imbudo 2003 Yap Island WSO Airport [37]
3 318.5 12.54 Winnie 1969 Yap Island WSO Airport [37]
4 313.9 12.36 Fern 1996 Yap Island WSO Airport [37]
5 301.8 11.88 Wilda 1967 Yap Island WSO Airport [37]
6 289.1 11.38 Ophelia 1958 Yap Island WSO Airport [37]
7 288.5 11.36 Hope 1985 Yap Island WSO Airport [37]
8 250.2 9.85 Georgia 1962 Yap Island WSO Airport [37]
9 236.5 9.31 Fran 1976 Yap Island WSO Airport [37]
10 231.9 9.13 Faye 1963 Yap Island WSO Airport [37]

Mozambique[edit]

Cyclone Freddy

The elevation of the country increases to the west, with mountains on its highest plateau reaching nearly 8,000 feet (2,400 m).[278]

Wettest tropical cyclones and their remnants in Mozambique
Highest-known totals
Precipitation Storm Location Ref.
Rank mm in
1 672 26.46 Freddy 2023 Marromeu [279]
2 600 24 Idai 2019 Chimoio
3 502 19.76 Eline 2000 Levubu [280]
4 281 11.06 Delfina 2003 [258]
5 200 7.87 Jokwe 2008 Nampula [281]
6 190 7.50 Japhet 2003 [282]

Myanmar[edit]

Cyclone Nargis near landfall
Wettest tropical cyclones and their remnants in Myanmar
Highest-known totals
Precipitation Storm Location Ref.
Rank mm in
1 600 23.62 Nargis 2008 [283]
2 343.9 13.54 T.D. No. 2 2007 [284]
3 300 11.81 Komen 2015 [285]

Nepal[edit]

Some of the highest elevations on the planet lie in Nepal. Eight out of fourteen highest peaks in the world lie in the Nepalese Himalaya including the highest peak of the World, Mt. Everest (8848 m).[286] During a tropical depression that affected the Indian Subcontinent in 2004, 51.3 millimetres (2.02 in) of rain fell at Kathmandu airport in the 24‑hour period ending at 1200 UTC on October 7.[76]

Netherlands Antilles[edit]

Saba[edit]

Wettest tropical cyclones and their remnants on Saba
Highest-known totals
Precipitation Storm Location Ref.
Rank mm in
1 286.3 mm 11.27 inches Alice (1954) [287]

St. Eustatius[edit]

Wettest tropical cyclones and their remnants on St. Eustatius
Highest-known totals
Precipitation Storm Location Ref.
Rank mm in
1 203.2 mm 8.00 inches Alice (1954) [287]

Saint Martin/Sint Maarten[edit]

This hilly island is partially owned by France and partially claimed by the Netherlands.

Hurricane Lenny
Wettest tropical cyclones and their remnants on Saint Martin/Sint Maarten
Highest-known totals
Precipitation Storm Location Ref.
Rank mm in
1 700.0 27.56 Lenny 1999 Meteorological Office, Phillpsburg [2]
2 280.2 11.03 Jose 1999 Princess Juliana International Airport [288]
3 165.1 6.50 Luis 1995 [289]
4 111.7 4.40 Otto 2010 Princess Juliana International Airport [290]
5 92.3 3.63 Rafael 2012 Princess Juliana International Airport [291]
6 51.0 2.01 Laura 2020 Princess Juliana International Airport [292]
7 42.6 1.68 Isaias 2020 Princess Juliana International Airport [293]
8 7.9 0.31 Ernesto 2012 Princess Juliana International Airport [291]
9 7.0 0.28 Chantal 2013 Princess Juliana International Airport [294]
10 6.6 0.26 Dorian 2013 Princess Juliana International Airport [294]

New Zealand[edit]

Cyclone Bola (1988)

Most tropical cyclones which pass near New Zealand are in extratropical transition (ET) or have become extratropical, which can enhance their heavy rainfall threat.

Wettest tropical cyclones and their remnants in New Zealand
Highest-known totals
Precipitation Storm Location Ref.
Rank mm in
1 970 38.19 Hilda 1990 North Egmont Visitor Centre [295]
2 917 36.10 Bola 1988 Glenross station [296]
3 762 30.00 Rewa 1994 Collier Creek [297]
4 488 19.21 Gabrielle 2023 Hikuwai River [298]
5 425 16.73 Fergus 1996 The Pinnacles [299][300]
6 415 16.34 Delilah 1989 Puhipuhi [301]
7 321 12.64 Dinah 1967 Mangahoe [302]
8 311 12.24 Beti 1996 The Pinnacles [303]
9 306 12.05 Giselle 1968 Leatham [304]
10 290 11.42 Ivy 2004 The Pinnacles [305]

Nicaragua[edit]

Hurricane Mitch
Wettest tropical cyclones and their remnants in Nicaragua
Highest-known totals
Precipitation Storm Location Ref.
Rank mm in
1 1597 62.87 Mitch 1998 Picacho/Chinandega [306]
2 674 26.55 Eta 2020 Puerto Corinto [55]
3 500 19.69 Joan 1988 [307]
4 447 17.60 Gert 1993 Chinandega [308]
5 368 14.49 Fifi 1974 Chinandega [308]
6 298 11.72 Alma 2008 Punto Sandino [309]
7 272 10.70 Cesar 1996 Bluefields [310]
8 231 9.10 Ida 2009 Puerto Cabezas [311]
9 181 7.11 Felix 2007 Puerto Cabezas [312]

Niue[edit]

Cyclone Heta

During the passage of Tropical Cyclone Heta in January 2004, the Niue Meteorological Station reported a record 24-hour rainfall of 999.2 millimetres (39.34 in).[313]

Wettest tropical cyclones and their remnants on Niue
Highest-known totals
Precipitation Storm Location Ref.
Rank mm in
1 999.2 mm 39.34 in Heta 2004 Niue Meteorological Station [313]
2 107.5 mm 4.23 in 01F 2014-15 [314]
3 101.8 mm 4.01 in Winston 2016 [314]
4 77.6 mm 3.06 in Tino 2015 [314]
5 66.2 mm 2.61 in Keli 1997 [315]
6 28.4 mm 1.12 in Ula 2015 [314]
7 23.9 mm 0.94 in Victor 2016 [314]
8 21.1 mm 0.83 in Ron 1998 [315]

Oman[edit]

Cyclone Mekunu
Wettest tropical cyclones and their remnants in Oman
Highest-known totals
Precipitation Storm Location Ref.
Rank mm in
1 617.0 24.29 Mekunu 2018 Salalah [316]
2 610.0 24.02 Gonu 2007 [317]
3 488.0 19.21 Phet 2010 JabalHilm
4 482.4 18.99 Masirah Cyclone 1977 Salalah [318]
5 300.2 11.82 T.S. 02A (1996) Dhofar [319]
6 285.5 11.24 Muscat Cyclone 1890 Muscat [318]
7 251.0 9.88 Oman Cyclone 2002 Qairoon [320]
8 250.0 9.84 Ashobaa 2015 Masirah Island [321]
9 230.0 9.06 Salalah Cyclone 1963 Salalah [318]
10 82.0 3.23 Salalah Cyclone 1959 Salalah [318]

Pakistan[edit]

Cyclone Phet, a cyclone making landfall in Pakistan in June 2010 as a deep depression

Tropical cyclones for the Arabian Sea usually affect Pakistan. Tropical cyclones from the Bay of Bengal can affect Pakistan, though they usually weaken by the time they reach the Pakistani coastline.[322]

Wettest tropical cyclones and their remnants in Pakistan
Highest-known totals
Precipitation Storm Location Ref.
Rank mm in
1 370 14.57 Phet (2010) Gwadar [323]
2 285 11.22 Cyclone (1999) Keti Bandar [324]
3 245 9.64 BOB 03 (2009) Karachi [325][326][327]
4 191 7.51 BOB 06 (2007) Karachi [328][329][330]
5 145 5.71 Onil (2004) Thatta [331]
6 110 3.94 Yemyin (2007) Karachi
7 43 1.69 BOB 04 (2007) Karachi [332][333]
8 18 0.70 BOB 03 (2009) Karachi [334]

Palau[edit]

Typhoon Mike

Palau consists of a string of islands that is rugged and surrounds a lagoon. Elevations up to 2,060 feet (630 m) exist within the island group.[335]

Wettest tropical cyclones and their remnants in Palau
Highest-known totals
Precipitation Storm Location Ref.
Rank mm in
1 470.9 18.54 Marie 1976 Koror [336]
2 293.1 11.54 Nathan 1993 Nekken Forestry [37]
3 281.4 11.08 Ruby 1982 Koror [37]
4 248.9 9.799 Mike 1990 Koror [337]
5 121.7 4.79 Dianmu 2004 Koror [338]
6 84.3 3.32 Bopha 2012 Koror [339]
7 47.8 1.88 Ewiniar 2006 Koror [340]

Panama[edit]

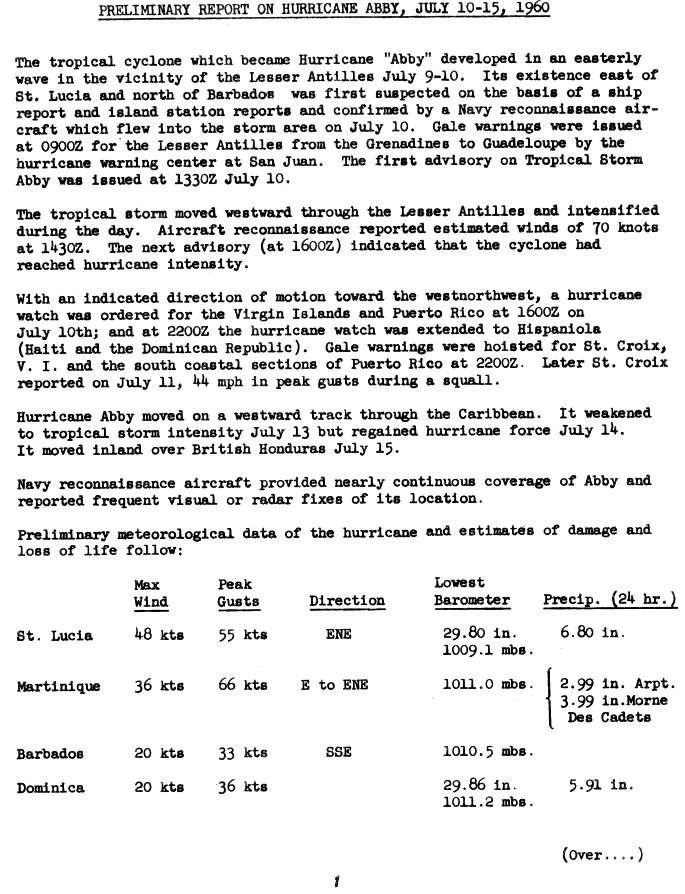
Inflow to the south of Hurricane Mitch brought impressive rainfalls to Panama. Veledero de Tole recorded 695 millimetres (27.4 in) of rainfall between October 22 and 31, 1998.

Philippines[edit]

Typhoon Parma/Pepeng

This Philippines island archipelago is fairly mountainous, with the highest terrain found in Luzon.

Wettest tropical cyclones and their remnants in the Philippine islands
Highest-known totals
Precipitation Storm Location Ref.
Rank mm in
1 2210.0 87.01 July 1911 cyclone Baguio [341]
2 1854.3 73.00 Pepeng (Parma) (2009) Baguio [342]
3 1216.0 47.86 Trining (Carla) (1967) Baguio [341]
4 1116.0 43.94 Iliang (Zeb) (1998) La Trinidad, Benguet [343]
5 1085.8 42.74 Feria (Utor) (2001) Baguio [344]
6 1077.8 42.43 Lando (Koppu) (2015) Baguio [342]
7 1012.7 39.87 Igme (Mindulle) (2004) [345]
8 902.0 35.51 Dante (Kujira) (2009) [346]
9 879.9 34.64 September 1929 typhoon Virac, Catanduanes [347]
10 869.6 34.24 Openg (Dinah) (1977) Western Luzon [348]

Samoa[edit]

Cyclone Tuni
Wettest tropical cyclones and their remnants in Samoa
Highest-known totals
Precipitation Storm Location Ref.
Rank mm in
1 508.2 20.01 Tuni, 2015 Afimalu [349]
2 470.5 18.52 Ula, 2016 Afimalu [349]
3 404.0 15.91 Evan, 2012 Alaoa, Upolu [350]
4 382.4 15.06 Amos, 2016 Afimalu [349]
5 320.0 12.60 Gita, 2018 Le-Pue [351]
6 190.0 7.48 01F 2014 Salani [349]
7 171.8 6.76 05F 2014 Salani [349]
8 170.6 6.72 08F, 2015 Letui [349]
9 169.5 6.67 19F, 2017 Lepiu [351]
10 138.4 5.45 09F, 2017 Afimalu [351]

Singapore[edit]

Typhoon Vamei of December 20, 2001 was the only known storm to ever hit the island state. It dropped 165.1 millimetres (6.50 in) of rainfall.

Solomon Islands[edit]

Cyclone Ita
Wettest tropical cyclones and their remnants in the Solomon Islands
Highest-known totals
Precipitation Storm Location Ref.
Rank mm in
1 >2100 >82.68 Namu 1986 Mount Popomanaseu, Guadalcanal [352]
2 >1000 >39.37 Ita 2014 Gold Ridge mine [353]
3 495 19.49 Pam 2015 Lata, Santa Cruz Island [354]
4 305 12.01 Angela 1966 Guadalcanal [355]
5 282 11.10 Raquel 2015 Munda, Western Province [356]

South Africa[edit]

Tropical Cyclone Eline in February 2000 dropped significant rains on portions of South Africa. The highest amount noted was 480 mm (19 in) at Thohoyandou.[357]

Spain[edit]

Wettest tropical cyclones and their remnants in Saint Kitts and Nevis
Highest-known totals
Precipitation Storm Location Ref.
Rank mm in
1 85 3.35 Vince Córdoba, Spain [358]

Sri Lanka[edit]

A tropical depression in early October 2004 led to heavy rains across Sri Lanka. The maximum was measured at Galle where 117.2 mm (4.61 in) fell in the 24‑hour period ending at 0600 UTC on the 2nd.[76]

St. Brandon, South Indian Ocean[edit]

Tropical Cyclone Darius of New Year's Eve/Day of 2003/2004 passed about 45 miles (72 km) west-northwest of the island. Rainfall over the 24‑hour period of closest approach was 135 mm (5.3 in).[359]

St. Kitts and Nevis[edit]

Wettest tropical cyclones and their remnants in Saint Kitts and Nevis
Highest-known totals
Precipitation Storm Location Ref.
Rank mm in
1 153.7 6.05 Alice (1954) [287]

Taiwan[edit]

The mountainous island of Taiwan experiences an average of 1.8 tropical cyclone landfalls each year.[citation needed] Due to its rugged topography, Taiwan sees extreme rains from tropical cyclones, particularly in its central mountain range.

Typhoon Morakot
Wettest tropical cyclones and their remnants in Taiwan
Highest-known totals
Precipitation Storm Location Ref.
Rank mm in
1 3,060 120.47 Morakot 2009 Alishan, Chiayi [360]
2 2,319 91.30 Nari 2001 Wulai, New Taipei [361]
3 2,162 85.12 Flossie 1969 Beitou, Taipei [360]
4 1,987 78.23 Herb 1996 Alishan, Chiayi [362]
5 1,774 69.84 Saola 2012 Yilan City [363]
6 1,700 66.93 Lynn 1987 Taipei [364]
7 1,672 65.83 Clara 1967 Dongshan, Yilan [365]
8 1,611 63.43 Sinlaku 2008 Heping, Taichung [366]
9 1,561 61.46 Haitang 2005 Sandimen, Pingtung [367]
10 1,546 60.87 Aere 2004 Miaoli County [368]

Thailand[edit]

Typhoon Zeke (1991)

Tropical cyclones occasionally cross the Malay Peninsula from the northwest Pacific into the Bay of Bengal.

Wettest tropical cyclones and their remnants in Thailand
Highest-known totals
Precipitation Storm Location Ref.
Rank mm in
1 493.8 19.44 Zeke 1991 Khlong Yai [37]
2 470.0 18.50 Tilda 1964 At Somat [369]
3 342.0 13.46 Vae 1952 Chantaburi [369]
4 328.7 12.94 Ira 1990 Lop Buri [37]
5 322.6 12.70 Ed 1990 Takua Pa [37]
6 279.5 11.00 18W (2013) Muang district [370]
7 273.6 10.77 Fred 1991 Khon Kaen [37]
8 257.3 10.13 Brian 1989 Takua Pa [37]
9 251.5 9.902 Muifa 2004 Prachaup Khirikhan [371]
10 239.5 9.429 Nell 1990 Ko Samui [37]

Tonga[edit]

Cyclone Waka (2001)
Wettest tropical cyclones and their remnants in Tonga
Highest-known totals
Precipitation Storm Location Ref.
Rank mm in
1 200.0 7.87 Waka 2001
2 167.0 6.57 Unnamed 1949 Nuku'alofa [372]
3 153.0 6.02 Lin 2009 Niuafo'ou [373]
4 152.2 6.00 Mick 2009 Fua'amotu
5 149.0 5.87 Rene 2010 Fua'amotu
6 120.0 4.72 Isaac 1982 Nuku'alofa [374]
7 120.0 4.72 Jasmine 2012 Tongatapu [375]
8 97.7 3.85 Vaianu 2006 Fuaʻamotu [376]
9 44.8 1.76 Cyril 2012 Vava'u [377]
10 37.5 1.48 Wilma 2011 Fua'amotu [378]

United Kingdom[edit]

Mainland[edit]

Hurricane Bertha (2014)
Wettest tropical cyclones and their remnants in the United Kingdom
Highest-known totals
Precipitation Storm Location Ref.
Rank mm in
1 150.0 5.91 Bertha 2014 Inverness, Highland [379]
2 135.0 5.31 Charley 1986 Abergwyngregyn, Gwynedd [380]
3 130.0 5.12 Nadine 2012 Ravensworth, North Yorkshire [381]
4 76.0 2.99 Lili 1996 Chale Bay, Isle of Wight [382]
5 61.7 2.43 Zeta 2020 Chipping, Lancashire [383]
6 48.8 1.92 Grace 2009 Capel Curig, Conwy [384]
7 42.2 1.66 Gordon 2006 Wainfleet All Saints, Lincolnshire [385]
8 38.0 1.50 Gonzalo 2014 Glenmoriston, Highland [386]
9 31.0 1.22 Bill 2009 Shap, Cumbria [387]
10 30.0 1.18 Laura 2008 Windermere, Cumbria [388]

Anguilla[edit]

Hurricane Jose (1999)
Wettest tropical cyclones and their remnants Anguilla
Highest-known totals
Precipitation Storm Location Ref.
Rank mm in
1 490.0 19.29 Lenny 1999 [389]
2 380.0 14.96 Jose 1999 [389]
3 250.0 9.84 Klaus 1990 [389]
4 171.5 6.75 Alice 1954 [287]

Bermuda[edit]

Bermuda has not historically received overwhelming rains out of tropical cyclones. This could be because of the rapid pace storms usually pass the island and the lack of mountains on the island.

Hurricane Nicole (2016)
Wettest tropical cyclones and their remnants in Bermuda
Highest-known totals
Precipitation Storm Location Ref.
Rank mm in
1 186.7 7.35 October 1939 Hurricane [390]
2 172.0 6.77 Nicole 2016 [391]
3 153.7 6.05 Arlene 1963 [37]
4 151.4 5.96 Cristobal 2002
5 148.0 5.83 Nicole 2004
6 134.1 5.28 T.D. #23A 1967 [37]
7 126.2 4.97 Franklin 2005
8 125.0 4.92 Emily 1981 [37]
9 124.0 4.88 Harvey 2005
10 123.2 4.85 September 1948 hurricane [390]

Cayman Islands[edit]

Tropical Storm Alberto
Wettest tropical cyclones and their remnants in the Cayman Islands
Highest-known totals
Precipitation Storm Location Ref.
Rank mm in
1 794.8 31.29 Unnamed, 1944 Grand Cayman Island [392]
2 577 22.72 Alberto, 2006 Owen Roberts International Airport [393]
3 552.2 21.74 Isidore, 2002 Cayman Brac [394]
4 451.4 17.77 Paloma, 2008 Cayman Brac [395]
5 308.4 12.14 Ivan, 2004 Grand Cayman Island [396]
6 292.1 11.50 Hattie, 1961 Grand Cayman Island [397]
7 250.7 9.87 Eta 2020 Grand Cayman [55]
8 229.1 9.02 Nicole, 2010 Owen Roberts International Airport [398]
9 165.6 6.52 Michelle, 2001 Grand Cayman Island [399]

United States[edit]

Hurricane Harvey (2017)
Wettest tropical cyclones and their remnants in the United States
Highest-known totals
Precipitation Storm Location Ref.
Rank mm in
1 1538.7 60.58 Harvey 2017 Nederland, Texas [37]
2 1321 52.02 Lane 2018 Mountainview, Hawaii [400][401]
3 1321 52.00 Hiki 1950 Kanalohuluhulu Ranger Station, Hawaii [402]
4 1219 48.00 Amelia 1978 Medina, Texas [37]
5 1148 45.20 Easy 1950 Yankeetown, Florida [37]
6 1143 45.00 Claudette 1979 Alvin, Texas [37]
7 1096 43.15 Imelda 2019 Jefferson County, Texas [403]
8 1058.7 41.68 T. D. #15 1970 Jayuya, Puerto Rico [37]
9 1033 40.68 Allison 2001 Northwest Jefferson County, Texas [37]
10 985 38.76 Paul 2000 Kapapala Ranch 36, Hawaii [404]

Vanuatu[edit]

Cyclone Vania (2011)
Wettest tropical cyclones and their remnants in Vanuatu
Highest-known totals
Precipitation Storm Location Ref.
Rank mm in
1 847.6 33.37 Bola 1988 Lamap [405]
2 545.0 21.46 Dani 1999 Bauerfield Airport [406]
3 369.1 14.53 Vania 2011 Aneityum [407]
4 270.0 10.63 Eric 1985 Surukavian, Pentecost [408]
5 266.6 10.50 Sarah 1994 Santo-Pekoa International Airport [409]
6 254.4 10.02 Ivy 2004 Bauerfield Airport [410]
7 247.6 9.75 Anne 1988 Santo-Pekoa International Airport [409]
8 246.6 9.71 Nigel 1985 Santo-Pekoa International Airport [409]
9 223.7 8.81 Zuman 1998 Santo-Pekoa International Airport [409]
10 219.3 8.63 Esau 1992 Santo-Pekoa International Airport [409]

Venezuela[edit]

A few tropical cyclones have skimmed the northern coast of South America over recent decades. Tropical Storm Bret (1993) dropped 339 millimetres (13.3 in) of rain in ten hours at Guanare, Portuguesa, Venezuela.[411]

Vietnam[edit]

Flooding in Hue, Vietnam triggered by Typhoon Ketsana in 2009
Wettest tropical cyclones and their remnants in Vietnam
Highest-known totals
Precipitation Storm Location Ref.
Rank mm in
1 1,773 69.8 Peipah 2007 Nam Đông [412]
2 1,691 66.6 Ofel 2020 Kỳ Thượng [413]
3 1,369 53.9 06W 2007 Hương Khê [412]
4 1,239 48.8 September 2009 Vietnam tropical depression Da Nang [414]
5 914 36.0 Ketsana 2009 Quảng Nam [414]
6 788 31.0 Lekima 2007 [412]
7 747 29.4 Aere 2016 Đồng Hới, Quảng Bình [415]
8 699 27.5 Ira 1990 [416]
9 666 26.2 Mirinae 2009 Vân Canh [414]
10 550 21.7 Xangsane 2006 [417]

See also[edit]

References[edit]

  1. ^ "Archived copy" (PDF). Archived from the original (PDF) on April 13, 2014. Retrieved April 11, 2014.{{cite web}}: CS1 maint: archived copy as title (link)
  2. ^ a b c Guiney, John L (December 9, 1999). Preliminary Report: Hurricane Lenny November 13 - 23, 1999 (PDF) (Report). United States National Hurricane Center. Retrieved April 25, 2016.
  3. ^ a b c d e f g h i "Antiguan Tropical Cyclones 1851 – 2016". Antigua and Barbuda Meteorological Service. July 4, 2017. Archived from the original on May 13, 2012. Retrieved January 25, 2018.
  4. ^ Bureau of Meteorology. Heavy rainfall and major flooding in Far North Queensland. Retrieved on 19 December 2023.
  5. ^ a b "Climate Education: Flood". Australian Bureau of Meteorology. Archived from the original on March 17, 2009. Retrieved January 18, 2011.
  6. ^ Bureau of Meteorology. Tropical Cyclones in Queensland. Retrieved on 17 July 2015.
  7. ^ "Tropical Cyclone Fletcher Impacts". Bureau of Meteorology. Government of Australia. 2014. Retrieved March 5, 2014.
  8. ^ "Kowanyama, Queensland February 2014 Daily Weather Observations" (PDF). Bureau of Meteorology. Government of Australia. 2014. Archived from the original (PDF) on March 6, 2014. Retrieved March 6, 2014.
  9. ^ "Report on Severe Tropical Cyclone Aivu: Rainfall" (PDF). Bureau of Meteorology. Government of Australia. June 6, 1990. p. 17–18. Retrieved March 13, 2014.
  10. ^ "Tropical Cyclone May". Australian Bureau of Meteorology. 2013. Retrieved January 29, 2013.
  11. ^ Queensland Tropical Cyclone Warning Centre (2014). "Tropical Cyclone Justin" (PDF). Australian Bureau of Meteorology. Retrieved March 11, 2014.
  12. ^ "Tropical Cyclone Ellie". Australian Bureau of Meteorology. 2009. Retrieved January 27, 2013.
  13. ^ Williams, Brian; Michael, Peter (January 24, 2013). "Ex-cyclone Oswald heads south with heavy rain tipped for long weekend". The Courier Mail. Australian Associated Press. Archived from the original on January 24, 2013. Retrieved January 24, 2013.
  14. ^ a b c d e f "Tropical Cyclones Affecting the Cocos Islands and Christmas Island". Australian Bureau of Meteorology's Perth Tropical Cyclone Warning Centre. Archived from the original on April 11, 2012. Retrieved August 3, 2014.
  15. ^ Tropical Cyclone Dahlia (Report). Australian Bureau of Meteorology. Archived from the original on April 19, 2019. Retrieved December 11, 2017.
  16. ^ "Daily Rainfall at Christmas Island Aero (Updated at 20 November 2021)" (PDF). www.bom.gov.au. Melbourne, Victoria: Bureau of Meteorology. Archived from the original (PDF) on November 20, 2021. Retrieved November 20, 2021.
  17. ^ Severe Tropical Cyclone Gillian (Report). Australian Bureau of Meteorology. Archived from the original on September 23, 2015. Retrieved August 3, 2014.
  18. ^ Conroy, Adam (May 4, 2023). Tropical Cyclone Odette (PDF) (Report). Australian Bureau of Meteorology. Retrieved May 22, 2023.
  19. ^ Padgett, Gary. "Monthly Global Tropical Cyclone Summary: March 2007". Archived from the original on January 17, 2013. Retrieved August 3, 2014.
  20. ^ Tropical Cyclone Cecily December 11–19, 1973 (PDF) (Report). Australian Bureau of Meteorology. p. 2. Archived (PDF) from the original on September 24, 2015. Retrieved August 10, 2014.
  21. ^ Courtney, Joe (August 28, 2008). Tropical Cyclone Rosie, April 20–24, 2008 (PDF) (Report). Australian Bureau of Meteorology's Perth Tropical Cyclone Warning Centre. Archived (PDF) from the original on September 24, 2015. Retrieved April 9, 2014.
  22. ^ a b Tropical Cyclone Norah October 28 – November 4, 1974 (PDF) (Report). Australian Bureau of Meteorology. November 19, 2010. p. 2. Archived (PDF) from the original on January 20, 2016. Retrieved December 3, 2015.
  23. ^ Tropical Cyclone Denise: May 19 – 25, 1975 (PDF) (Report). Australian Bureau of Meteorology. November 19, 2010. p. 2. Archived (PDF) from the original on January 20, 2016. Retrieved December 3, 2015.
  24. ^ a b "Tropical Low 11U" (PDF). Australian Bureau of Meteorology's Western Australian Regional Office. March 2013. Archived (PDF) from the original on September 23, 2015. Retrieved August 3, 2014.
  25. ^ Perth Tropical Cyclone Warning Centre (June 12, 2009). Severe Tropical Cyclone Walter April 1 – 8, 2001 (PDF) (Individual Cyclone Reports). Australian Bureau of Meteorology. pp. 1–2. Archived (PDF) from the original on March 20, 2012. Retrieved July 22, 2012.
  26. ^ Severe Tropical Cyclone Tropical Cyclone Adeline 1 – 5 April 2005 (PDF) (Report). Australian Bureau of Meteorology's Perth Tropical Cyclone Warning Centre. November 19, 2010. pp. 1–2. Archived (PDF) from the original on September 24, 2015. Retrieved August 3, 2014.
  27. ^ Tropical Cyclone Deidre 20 – 25 December 1973 (PDF) (Report). Australian Bureau of Meteorology. p. 2. Archived (PDF) from the original on April 2, 2011. Retrieved August 10, 2014.
  28. ^ Western Australian Regional Office (2013). Severe Tropical Cyclone Bruce (Report). Australian Bureau of Meteorology. Archived from the original on September 23, 2015. Retrieved January 11, 2015.
  29. ^ "Cocos Island: December 2013 Daily Weather Observations". Australian Bureau of Meteorology. January 1, 2014. Archived from the original on January 2, 2015. Retrieved January 11, 2015.
  30. ^ Western Australian Regional Office (January 1, 2015). Severe Tropical Cyclone Kate (Report). Australian Bureau of Meteorology. Archived from the original on September 23, 2015. Retrieved January 1, 2015.
  31. ^ "Cocos Island: December 2014 Daily Weather Observations". Australian Bureau of Meteorology. January 1, 2015. Archived from the original on January 2, 2015. Retrieved January 1, 2015.
  32. ^ Tropical Cyclone Annie November 21, 1973 to December 8, 1973 (PDF) (Report). Australian Bureau of Meteorology's Perth Tropical Cyclone Warning Centre. August 13, 2009. p. 2. Archived from the original (PDF) on March 20, 2012. Retrieved August 10, 2014.
  33. ^ Tropical Cyclone Anggrek (Report). Australian Bureau of Meteorology's Western Australian Regional Office. 2010. p. 2. Archived from the original on September 23, 2015. Retrieved August 10, 2014.
  34. ^ Brown, Daniel P (December 17, 2007). Tropical Cyclone Report: Hurricane Noel (PDF) (Report). United States National Hurricane Center. p. 4. Retrieved April 25, 2016.
  35. ^ Avila, Lixion A; Stewart, Stacy R; Berg, Robbie; Hagen, Andrew B (April 20, 2020). Tropical Cyclone Report: Hurricane Dorian (PDF) (Report). United States National Hurricane Center. Retrieved April 28, 2020.
  36. ^ Stewart, Stacy R (April 3, 2017). Tropical Cyclone Report: Hurricane Matthew (PDF) (Report). United States National Hurricane Center. Retrieved April 6, 2017.
  37. ^ a b c d e f g h i j k l m n o p q r s t u v w x y z aa ab ac ad ae af ag ah ai aj ak al am an ao ap aq ar as at au av aw ax ay az ba bb bc bd be bf bg bh bi bj bk bl Roth, David M. (January 3, 2023). "Tropical Cyclone Point Maxima". Tropical Cyclone Rainfall Data. United States Weather Prediction Center. Retrieved January 6, 2023. Public Domain This article incorporates text from this source, which is in the public domain.
  38. ^ Beven III, John L (January 23, 2002). Tropical Cyclone Report: Hurricane Michelle (PDF) (Report). United States National Hurricane Center. Retrieved June 10, 2012.
  39. ^ Rappaport, Edward N (November 26, 1995). Preliminary Report: Hurricane Erin (PDF) (Report). United States National Hurricane Center. Retrieved June 10, 2012.
  40. ^ Beven III, John L; Stewart, Stacey R (February 8, 2009). Tropical Cyclone Report: Tropical Storm Fay 2008 (PDF) (Report). United States National Hurricane Center. Retrieved June 10, 2012.
  41. ^ Pasch, Richard J; Kimberlain, Todd B; Stewart, Stacey R (November 18, 1999). Preliminary Report: Hurricane Floyd (PDF) (Report). United States National Hurricane Center. Retrieved June 10, 2012.
  42. ^ Nick Wiltgen (July 31, 2015). "Tropical Cyclone Komen Soaking Waterlogged Bangladesh, Myanmar; At Least 33 Reported Dead, 6 Missing". The Weather Channel. Retrieved July 31, 2015.
  43. ^ "Bangladesh: Tropical Cyclone Rashmi" (PDF). World Food Program. United Nations. 2008. Archived from the original (PDF) on April 11, 2013. Retrieved March 30, 2010.
  44. ^ Padgett, Gary; Kevin Boyle; John Wallace; Huang Chunliang; Simon Clarke (May 17, 2005). "Monthly Global Tropical Cyclone Summary September 2004". Australian Severe Weather Index. Jimmy Deguara. Retrieved January 13, 2007.
  45. ^ "Crops on 1.28 lakh hectares land damaged". The Daily Star. May 18, 2013. Retrieved May 18, 2013.
  46. ^ Padgett, Gary; Kevin Boyle; John Wallace; Huang Chunliang; Simon Clarke (May 17, 2005). "Monthly Global Tropical Cyclone Summary October 2004". Retrieved January 13, 2007.
  47. ^ 1970 Annual Summary Part C — Storms & Depressions (PDF) (India Weather Review). India Meteorological Department. p. 10. Archived from the original on June 1, 2012. Retrieved June 1, 2012.
  48. ^ "Cyclone Sidr Rainfall Total". NASA. 2007. Retrieved June 15, 2009.
  49. ^ Staff Writer (2009). "Cyclone Aila Preliminary Report" (PDF). India Meteorological Department. Retrieved June 15, 2009.
  50. ^ Hal Pierce and Rob Gutro (April 20, 2009). "Hurricane Season 2009: Bijli (Northern Indian Ocean)". NASA. Retrieved May 23, 2009.
  51. ^ International Federation of Red Cross And Red Crescent Societies (2007). "Bangladesh: Cyclonic Storm Information Bulletin No. 01/2007". Retrieved May 17, 2007.
  52. ^ Biological-Diversity.info. Biological Diversity in Belize. Retrieved on February 19, 2007.
  53. ^ Beven II, John L (January 29, 2001). Tropical Cyclone Report: Hurricane Keith: September 28 - October 6, 2000. National Hurricane Center (Technical report). National Oceanic and Atmospheric Administration. Archived from the original on January 16, 2013. Retrieved July 29, 2014.
  54. ^ Beven II, John L (January 29, 2001). Tropical Cyclone Report: Hurricane Keith: September 28 - October 6, 2000. National Hurricane Center (Technical report). National Oceanic and Atmospheric Administration. Archived from the original on July 29, 2014. Retrieved July 29, 2014.
  55. ^ a b c d e f g h Richard J. Pasch and David P. Roberts (2021-06-09). Tropical Cyclone Report: Hurricane Eta - 31 October-13 November 2020. National Hurricane Center Retrieved on June 12, 2021.
  56. ^ Brown, Daniel P (January 29, 2001). Tropical Cyclone Report: Tropical Depression Sixteen: October 14-15, 2008 (PDF). National Hurricane Center (Technical report). National Oceanic and Atmospheric Administration. p. 4. Archived from the original on July 29, 2014. Retrieved July 29, 2014.
  57. ^ a b Robbie Berg (2020-09-10). Tropical Cyclone Report: Tropical Storm Amanda - 30-31 May 2020. National Hurricane Center Retrieved on June 12, 2021.
  58. ^ Franklin, James L (September 6, 2001). Tropical Cyclone Report: Tropical Storm Chantal: August 14 - 21, 2001. National Hurricane Center (Technical report). National Oceanic and Atmospheric Administration. Archived from the original on July 29, 2014. Retrieved July 29, 2014.
  59. ^ a b c Geology. List of Appendices. Retrieved on 2007-04-08.
  60. ^ Hunting Caye Automatic Weather Station (1993). "Hourly Data during passage of Tropical Storm Gert". Retrieved December 21, 2008.
  61. ^ National Hurricane Center (1974). "Hurricane Fifi Preliminary Report Page 2". Retrieved December 21, 2008.
  62. ^ Daily Rainfall from Kompot, Cambodia in 1997. Retrieved on 2008-03-14.
  63. ^ Hydrometeorological Branch of the Office of Hydrology of the United States Weather Bureau (May 1970). "Hydrometeorological Report Number 46: Probable Maximum Precipitation, Mekong River Basin" (PDF). United States Government Printing Office. pp. 142–145. Retrieved June 6, 2012.
  64. ^ Daily Rainfall from Kompong Cham, Cambodia in 1998. Retrieved on 2008-03-14.
  65. ^ "1999-Harvey". Environment Canada. September 14, 2010. Retrieved September 14, 2011.
  66. ^ Environment Canada. Canadian Hurricane Centre: Impacts of Hurricanes. Retrieved on 2007-03-08.
  67. ^ "Hurricane Igor drenches Newfoundland peninsula". Toronto Star. September 21, 2010. Retrieved September 21, 2010.
  68. ^ "Sydney hit with 225 mm of rain, other parts of Nova Scotia get more than 100 mm". CBC News. October 10, 2016. Retrieved August 2, 2017.
  69. ^ Environment Canada. Remembering Hurricane Hazel: Storm Information. Retrieved on 2007-03-08.
  70. ^ "Hurricane Fiona Tropical Cyclone Report" (PDF). National Hurricane Center. March 23, 2023. Retrieved March 23, 2023.
  71. ^ VOCM [https://vocm.com/2022/09/12/trepassey-earl/ Complete “Devastation” in Trepassey Following Damage From Earl, says Area MHA September 2022.] Retrieved on 2022-09-12.
  72. ^ Dr. Hal Garrish. Hurricane Bertha Statistics. Retrieved on 2007-03-08.
  73. ^ "2. Super Storm Sandy and Another Active Hurricane Season". Environment Canada. December 20, 2012. Retrieved December 24, 2012.
  74. ^ Canadian Hurricane Centre (2002). "2001 Tropical Cyclone Season Summary". Retrieved February 27, 2007.
  75. ^ Hong Kong Observatory. Weather Cases: Typhoon Sam Retrieved on June 23, 2007.
  76. ^ a b c Padgett, Gary; Kevin Boyle; John Wallace; Huang Chunliang; Simon Clarke (May 17, 2005). "Monthly Global Tropical Cyclone Summary October 2004". Retrieved January 13, 2007.
  77. ^ Burt, Christopher C. (May 30, 2018). "The Deadliest Weather-Related Catastrophe You Probably Never Heard Of". Weather Underground. Archived from the original on January 12, 2022. Retrieved January 15, 2022.
  78. ^ Meili, Cao (July 26, 2021). 余姚暴雨累计雨量达951毫米 相当于余姚近三天下了约37个西湖的水量. Sina News (in Chinese). Archived from the original on July 27, 2021. Retrieved July 27, 2021.
  79. ^ Padgett, Gary (December 27, 2006). "Monthly Global Tropical Cyclone Summary August 2001". Australian Severe Weather Index. Jimmy Deguara. Retrieved January 13, 2007.
  80. ^ 重要天气新闻通稿: 今年第13号 台风"苏迪罗"深入内陆影响结束. National Meteorological Center (in Chinese). August 11, 2015. Archived from the original on August 11, 2015. Retrieved August 11, 2015.
  81. ^ "Beijing records heaviest rainfall in at least 140 years, causing severe flooding and 21 deaths". ABC News. Retrieved August 3, 2023.
  82. ^ Zhang, Shuai (August 2, 2023). "China sees record flooding in Beijing, with 20 deaths and mass destruction blamed on Typhoon Doksuri". cbsnews.com. Retrieved August 3, 2023.
  83. ^ Mary Gilbert. "Chanthu to produce days of tropical rainfall, raise flood risk in South Korea and Japan". Accuweather. Archived from the original on September 17, 2021. Retrieved September 17, 2021.
  84. ^ "China: Floods — Information Bulletin no 2". International Federation of Red Cross and Red Crescent Societies. August 10, 2012. Retrieved August 10, 2012 – via ReliefWeb.
  85. ^ "AIR Post-Disaster Survey for Typhoon Chanchu Documents the Vulnerability of the Chinese Building Stock to Wind and Flood". AIR Worldwide. Archived from the original on September 27, 2007. Retrieved February 25, 2007.
  86. ^ a b c d e f g h i j Tropical Cyclones in 2010 (PDF) (Report). Hong Kong Observatory. p. 98. Retrieved May 14, 2012.
  87. ^ MSc. Gulliermo Vega G. (June 3, 2004). "Conferencia 1. Aspectos Hidrometeorologicos del Huracan Cesar" (PDF). p. 43. Archived from the original (PDF) on July 18, 2011. Retrieved November 7, 2009.
  88. ^ John L. Beven II and Robbie Berg (April 5, 2018). Tropical Cyclone Report: Hurricane Nate (PDF) (Report). Miami, Florida: National Hurricane Center. Retrieved April 12, 2018.
  89. ^ Naciones Unidas a Centroamérica (March 16, 1999). "Costa Rica: Evaluación de los Daños Ocasionados por el Huracán Mitch, 1998: Sus implicaciones para el desarrollo económico y social y el medio ambiente". United Nations. p. 10. {{cite web}}: Missing or empty |url= (help)
  90. ^ Daniel P. Brown. Tropical Cyclone Report: Tropical Storm Alma. Retrieved on November 29, 2008.
  91. ^ Fallas, Jorge; Valverde, Carmen (2005). "Evidence-based Policy for Integrated Control of Forested River Catchments in Extreme Rainfall and Snowmelt" (PDF). Epic-Force. p. 5. Retrieved October 8, 2011.[permanent dead link]
  92. ^ Brown, Daniel (2017). "Hurricane Otto" (PDF). NHC. p. 4. Retrieved June 18, 2017.
  93. ^ a b c d e f g h i j k Instituto Nacional de Recursos Hidráulicos (2012). "Lluvias intensas observadas y grandes inundaciones reportadas" (in Spanish). Archived from the original on November 5, 2013. Retrieved April 25, 2016.
  94. ^ WorldAtlas.com. Dominica. Retrieved on February 19, 2007.
  95. ^ a b Gary Padgett (May 17, 2005). "Monthly Global Tropical Cyclone Summary September 2004". Retrieved January 13, 2007.
  96. ^ Fred L. Ogden (March 19, 2016). Indirect Peak Discharge Measurements on the Island of Dominica Associated with Extreme Rainfall from Tropical Storm Erika, August 27, 2015, with Modeling and Analysis (PDF) (Report). Government of Dominica. Retrieved March 21, 2017.
  97. ^ Richard J. Pasch; Andrew B. Penny & Robbie Berg (April 5, 2018). Hurricane Maria (AL152017) (PDF) (Report). Tropical Cyclone Report. National Hurricane Center. Retrieved April 9, 2018.
  98. ^ Paul J. Hebert (July 1, 1980). "Atlantic Hurricane Season of 1979" (PDF). Monthly Weather Review. 108 (7). American Meteorological Society: 973–990. Bibcode:1980MWRv..108..973H. doi:10.1175/1520-0493(1980)108<0973:AHSO>2.0.CO;2. Retrieved August 28, 2015.
  99. ^ "Preliminary Report on Hurricane Abby, July 10–15, 1960". National Hurricane Center. p. 1.
  100. ^ Dominican Republic Page. Dominican Republic Geography. Retrieved on February 19, 2007.
  101. ^ Brown, Daniel P (December 17, 2007). Tropical Cyclone Report: Hurricane Noel 2007 (PDF) (Technical report). United States National Hurricane Center. p. 4. Retrieved April 25, 2016.
  102. ^ (in Spanish) "Lluvias dejan 3 muertos y 7.000 evacuados". Hoy. Periódico Hoy. Associated Press. August 5, 2011. Retrieved August 5, 2011.
  103. ^ (in Spanish) Hugo del Jesus Segura Soto (July 18, 2005). "Inundaciones rápidas en la República Dominicana" (PDF). Centro de Estudios Hidrográficos. p. 57.
  104. ^ ONAMET. Boletin Climatologico Mensual: Septiembre. Retrieved on 2007-03-09.
  105. ^ ONAMET. Boletin Climatologico Mensual: Agosto. Retrieved on 2007-03-09.
  106. ^ ONAMET. Boletin Climatologico Mensual: Octubre. Retrieved on 2007-03-09.
  107. ^ Brown, Daniel P; Kimberlain, Todd B; National Hurricane Center (March 27, 2009). Hurricane Hanna (PDF) (Tropical Cyclone Report). United States National Oceanic and Atmospheric Administration's National Weather Service. Retrieved June 1, 2012.
  108. ^ ONAMET. Boletin Climatologico Mensual: Mayo. Retrieved on 2007-03-09.
  109. ^ "Archived copy". Archived from the original on April 19, 2019. Retrieved September 6, 2018.{{cite web}}: CS1 maint: archived copy as title (link)
  110. ^ a b c d e "MARN - Depresión Tropical 12 e rompe récord histórico de lluvia acumulada".
  111. ^ http://mapas.snet.gob.sv/meteorologia/12E_octubre2011.pdf [bare URL PDF]
  112. ^ WFP El Salvador Situation Report #2 - Tropical Storm Amanda (17 June 2020) (PDF) (Report). Reliefweb. June 17, 2020. Retrieved August 24, 2020. {{cite report}}: Unknown parameter |agency= ignored (help)
  113. ^ Staff Writer (May 30, 2010). "Agatha tocó tierra, pero las lluvias siguen hoy" (in Spanish). El Salvador.com. Archived from the original on June 2, 2010. Retrieved May 30, 2010.
  114. ^ Campbell, John R (1984). Dealing with disaster: hurricane response in Fiji. p. 55. Archived from the original (PDF) on July 23, 2014. Retrieved July 23, 2014.
  115. ^ Prasad, Rajendra (February 19, 1993). Tropical Cyclone Kina, December 26, 1992 – January 5, 1993 (Tropical Cyclone Report 92/1). Fiji Meteorological Service. Archived from the original (PDF) on October 26, 2013. Retrieved October 26, 2013.
  116. ^ Climate Services Division (January 10, 2017). Fiji Islands Climate Summary December 2016 Volume 33 Issue 12 (Report). Fiji Meteorological Service. Archived from the original (PDF) on January 8, 2017. Retrieved January 17, 2017.
  117. ^ Krishna, Ram (January 4, 1981). Publication No. 2: Tropical Cyclones in Fiji: November 1969 – April 1980 (Report). Fiji Meteorological Service. p. 3-5.
  118. ^ Fiji Islands Climate Summary January 2021 Volume 34 Issue 1 (PDF) (Report). Fiji Meteorological Service. February 8, 2021. Archived from the original (PDF) on February 7, 2021. Retrieved February 8, 2021.
  119. ^ Prasad, Rajendra (April 11, 1985). Preliminary Report: Tropical Cyclone Gavin (Report). Fiji Meteorological Service.
  120. ^ Terry, James P; Raj, Rishi (1999). "Island Environment and Landscape Responses to 1997 Tropical Cyclones in Fiji". Pacific Science. 53 (3). University of Hawai'i Press: 257–272. Retrieved January 4, 2013.
  121. ^ Preliminary Report on Tropical Cyclone "June" — May 3 - 5, 1997 (Report). Fiji Meteorological Service. May 27, 1997. Archived from the original (PDF) on March 21, 2014. Retrieved March 21, 2014.
  122. ^ "April 2016". Fiji Climate Summary. Vol. 37, no. 4. Fiji Meteorological Service. May 6, 2016. Archived from the original (PDF) on March 12, 2024. Retrieved March 12, 2024.
  123. ^ Fiji Islands Climate Summary December 2012 (Report). Vol. 33. Fiji Meteorological Service. January 7, 2013. Archived from the original (PDF) on January 8, 2013. Retrieved January 8, 2013.
  124. ^ Padgett, Gary. "Monthly Global Tropical Cyclone Summary December 1999". Archived from the original on April 1, 2012. Retrieved April 1, 2012.
  125. ^ Padgett, Gary (December 1, 2005). "Monthly Tropical Cyclone Summary — December 2004". Australian Severe Weather. Retrieved February 22, 2010.
  126. ^ http://horizon.documentation.ird.fr/exl-doc/pleins_textes/doc34-05/35797.pdf
  127. ^ Padgett, Gary (December 1, 1998). "Monthly Tropical Cyclone Summary — December 1997". Australian Severe Weather. Retrieved February 22, 2010.
  128. ^ Météo-France French Polynesia (June 24, 2008). Review of the 2006-07 and 2007-08 tropical cyclone seasons (Report). World Meteorological Organization. Retrieved February 22, 2010.
  129. ^ National Hurricane Center (1996). Hurricane Marilyn Preliminary Report (Report). National Hurricane Center. Retrieved February 14, 2007.
  130. ^ "Tempête Fiona : l'état de catastrophe naturelle sera reconnu en Guadeloupe, annonce Darmanin" [Storm Fiona: the state of natural disaster will be recognized in Guadeloupe, announces Darmanin]. Europe 1 (in French). September 18, 2022. Retrieved October 13, 2022.
  131. ^ Service Régional de METEO-FRANCE en Guadeloupe. COMPTE RENDU METEOROLOGIQUE: Passage de l'Ouragan LENNY du 17 au 19 novembre 1999 sur l'archipel de la Guadeloupe. Retrieved on 2007-02-19. A
  132. ^ Avila, Lixion A; National Hurricane Center (October 23, 1996). Hurricane Hortense 3-16 September 1996 (Preliminary Report). United States National Oceanic and Atmospheric Administration's National Weather Service. Archived from the original on July 3, 2013. Retrieved June 17, 2012.
  133. ^ World Meteorological Organization. Review of the Past Hurricane Season. Retrieved on 2007-02-24.
  134. ^ (in French) AFP, France Antilles (September 3, 2009). "07 - La Tempête tropicale Erika affecte la Guadeloupe". Catastrophes Naturalles. Retrieved September 4, 2009.
  135. ^ "PASSAGE DE L'OURAGAN EARL SUR LA GUADELOUPE Et LES ILES DU NORD" [PASSAGE OF THE HURRICANE EARL ON THE GUADELOUPE AND THE NORTH ISLANDS] (PDF). meteo.fr (in French). Retrieved December 15, 2017.
  136. ^ Perrusset, Marcell; Bouguen, Pierre (1970). La Tempête Tropicale Dorothy (Report) (in French). Météo-France. table 1 as archived by the National Hurricane Center in its Storm Wallet for Tropical Storm Dorothy, 1970. Retrieved January 24, 2012.
  137. ^ 1990 Klaus: Ouragan. Pluies extrêmes aux Antilles (Report) (in French). Météo-France. n.d. Retrieved September 6, 2015.
  138. ^ 1967 Beulah: Ouragan. Pluies extrêmes aux Antilles (Report) (in French). Météo-France. n.d. Retrieved September 6, 2015.
  139. ^ Rappaport, Edward N. (November 2, 2000). "Hurricane Iris: 22 August–4 September 1995" (PDF). 1995 Atlantic Hurricane Season (Preliminary Report). National Hurricane Center. Retrieved September 6, 2015.
  140. ^ 1979 David: Ouragan. Pluies extrêmes aux Antilles (Report) (in French). Météo-France. n.d. Retrieved September 6, 2015.
  141. ^ Franklin, James L (January 31, 2008). Hurricane Dean (AL042007): August 13–23 2007 (PDF) (Technical report). National Hurricane Center. p. 4. Retrieved September 6, 2015.
  142. ^ Mayfield, Britt M (October 25, 1993). "Tropical Storm Cindy: 14–17 August 1993". Storm Wallet for Tropical Storm Cindy, 1993 (Preliminary Report). National Hurricane Center. p. 2. Retrieved September 6, 2015.
  143. ^ 1980 Allen: Ouragan. Pluies extrêmes aux Antilles (Report) (in French). Météo-France. n.d. Retrieved September 6, 2015.
  144. ^ Rappaport, Edward N (January 17, 1996). "Hurricane Marilyn: September 12–22, 1995" (PDF). 1995 Atlantic Hurricane Season (Preliminary Report). National Hurricane Center. Retrieved September 6, 2015.
  145. ^ a b c d e f g h i "Cyclone Passes De 1880 à nos jours" (in French). Meteo France New Caledonia. Retrieved January 2, 2017.
  146. ^ http://www.meteo.nc/en-savoir-plus/accueil/actualites/484-cook-la-vie-du-phenomene-et-ses-consequences
  147. ^ Lyons, Steve (February 17, 2010). "La Reunion Island's Rainfall Dynasty!". The Weather Channel. Archived from the original on February 10, 2014. Retrieved February 4, 2014.
  148. ^ a b c d Quetelard, Hubert; Bessemoulin, Pierre; Cerveny, Randall S; Peterson, Thomas C; Burton, Andrew; Boodhoo, Yadowsun (2009). "Extreme Weather: World-Record Rainfalls During Tropical Cyclone Gamede". Bulletin of the American Meteorological Society. 90 (5). American Meteorological Society: 603–608. Bibcode:2009BAMS...90..603Q. doi:10.1175/2008BAMS2660.1.
  149. ^ a b c d e Landsea, Christopher W; Hurricane Research Division (March 12, 2007). "Subject: E4) What are the largest rainfalls associated with tropical cyclones?". Tropical Cyclone Frequently Asked Questions. Archived from the original on February 3, 2014. Retrieved April 12, 2013.
  150. ^ Précipitations extrêmes (Report). Meteo France. Retrieved April 15, 2013.
  151. ^ "Actualité du mois Influence du Cyclone Tropical Intense BATSIRAI à La Réunion (du 1er au 5 février 2022)" (PDF). Meteo France La Reunion. Retrieved February 14, 2022.
  152. ^ Padgett, Gary (December 27, 2006). "Monthly Global Tropical Cyclone Summary January 2002". Australian Severe Weather Index. Jimmy Deguara. Retrieved January 16, 2007.
  153. ^ "SYNTHÈSEDESÉVÉNEMENTS : FIRINGA, cyclone tropical modéré (29 janvier 1989)" (PDF). Retrieved October 8, 2023.
  154. ^ "COMMUNIQUE". February 21, 2009. Archived from the original on February 21, 2009. Retrieved October 19, 2016.{{cite web}}: CS1 maint: bot: original URL status unknown (link)
  155. ^ Tropical Cyclone Florine 4–10 January. National Climatic Data Center (Report). Global tropical/extratropical cyclone climatic atlas. 1996. Retrieved November 20, 2016.
  156. ^ RSMC La Reunion (January 22, 2014). "Cyclone Tropical Bejisa (du 1 er au 3 janvier 2014)" (PDF) (in French). Meteo France. p. 1. Archived from the original (PDF) on February 21, 2014. Retrieved February 3, 2014.
  157. ^ Pasch, Richard J; National Hurricane Center (November 22, 1999). Hurricane Jose: October 17 – 25, 1999 (Preliminary Report). United States National Oceanic and Atmospheric Administration's National Weather Service. Retrieved December 7, 2012.
  158. ^ Cangialosi, John P; National Hurricane Center (November 17, 2010). Hurricane Otto October 6–10 (PDF) (Tropical Cyclone Report). United States National Oceanic and Atmospheric Administration's National Weather Service. pp. 6–7. Retrieved December 7, 2012.
  159. ^ "Passage De L'ouragan Earl sur la Guadeloupe et Les Iles du north es 29 et 30 août 2010" (PDF) (in French). Météo-France. November 5, 2010. p. 5. Retrieved December 7, 2012.
  160. ^ Rappaport, Edward N; National Hurricane Center (January 17, 1996). Hurricane Marilyn: September 12 – 22, 1995 (Preliminary Report). United States National Oceanic and Atmospheric Administration's National Weather Service. Retrieved December 7, 2012.
  161. ^ a b c d e f g h i "Wallis and Futuna Cyclone Passes De 1880 à nos jours" [Wallis and Futuna Cyclone Passes From 1880 to the present day] (in French). Meteo France New Caledonia. Retrieved January 2, 2017.
  162. ^ "Cyclone Amos: les Samoa ravagées" [Cyclone Amos: ravaged Samoa]. Meteo (in French). Retrieved April 24, 2016.
  163. ^ "Death toll from storm Agatha rises in Central America". BBC News. May 31, 2010. Retrieved May 31, 2010.
  164. ^ Robert C. Bucknam; Jeffrey A. Coe; Manuel Mota Chavarria; Jonathan W. Godt; Arthur C. Tarr; Lee-Ann Bradley; Sharon A. Rafferty; Dean Hancock; Richard L. Dart; Margo L. Johnson (2001). "Landslides triggered by Hurricane Mitch in Guatemala − inventory and discussion". United States Geological Survey. Retrieved November 7, 2009.
  165. ^ http://www.insivumeh.gob.gt/meteorologia/agatha.pdf [bare URL PDF]
  166. ^ Earth Observatory (September 22, 2008). "Hurricane Stan Floods Central America". National Aeronautics and Space Administration. Retrieved November 7, 2009.
  167. ^ Earth Observatory (May 25, 2005). "Tropical Storm Adrian May 16–21 Rainfall Totals". National Aeronautics and Space Administration. Archived from the original on February 13, 2010. Retrieved November 7, 2009.
  168. ^ Michigan Technological University Volcanoes Page (August 15, 1994). "Rainfall". Retrieved November 7, 2009.
  169. ^ Dardik, Alan, ed. (2016). Vascular Surgery: A Global Perspective. Springer. p. 341. ISBN 9783319337456.
  170. ^ Josh, Jagran, ed. (2016). "Current Affairs November 2016 eBook". p. 93.
  171. ^ Nation's Encyclopedia. Haiti. Retrieved on February 19, 2007.
  172. ^ Dunn, Gordon E; Moore, Paul L; Clark, Gilbert B; Frank, Neil L; Hill, Elbert C; Kraft, Raymond H; Sugg, Arnold L (1964). "The Hurricane Season of 1963" (PDF). Monthly Weather Review. 92 (3). American Meteorological Society: 136. Bibcode:1964MWRv...92..128D. doi:10.1175/1520-0493-92.3.128. ISSN 0027-0644. Archived (PDF) from the original on June 9, 2012. Retrieved May 13, 2012.
  173. ^ Brown, Daniel P (December 17, 2007). Tropical Cyclone Report: Hurricane Noel (PDF) (Report). United States National Hurricane Center. p. 4. Archived from the original on June 9, 2012. Retrieved June 1, 2012.
  174. ^ Stewart, Stacy R (April 3, 2017). Tropical Cyclone Report: Hurricane Matthew (PDF) (Report). United States National Hurricane Center. p. 4. Archived from the original on June 9, 2012. Retrieved April 6, 2017.