
 French
 Deutsch
File:Time Series Representation of Social Security Expenditure .jpg
No higher resolution available.
Time_Series_Representation_of_Social_Security_Expenditure_.jpg (435 × 310 pixels, file size: 28 KB, MIME type: image/jpeg)
| This is a file from the Wikimedia Commons. Information from its description page there is shown below. Commons is a freely licensed media file repository. You can help. |
Summary
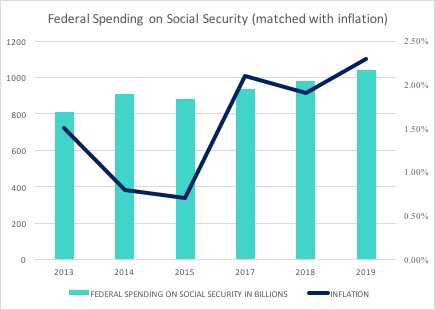
| Description | English: This graph shows the U.S Federal Expenditure on Social Security over the time period of 2013-2019. It also shows the level of inflation in the country which can be used as a point of comparison for the expenditure levels. |
| Date | |
| Source | Own work |
| Author | 8713LOLA |
Licensing
I, the copyright holder of this work, hereby publish it under the following license:
This file is licensed under the Creative Commons Attribution-Share Alike 4.0 International license.
- You are free:
- to share – to copy, distribute and transmit the work
- to remix – to adapt the work
- Under the following conditions:
- attribution – You must give appropriate credit, provide a link to the license, and indicate if changes were made. You may do so in any reasonable manner, but not in any way that suggests the licensor endorses you or your use.
- share alike – If you remix, transform, or build upon the material, you must distribute your contributions under the same or compatible license as the original.
File history
Click on a date/time to view the file as it appeared at that time.
| Date/Time | Thumbnail | Dimensions | User | Comment | |
|---|---|---|---|---|---|
| current | 17:58, 12 March 2020 | | 435 × 310 (28 KB) | 8713LOLA | Cross-wiki upload from en.wikipedia.org |
File usage
The following pages on the English Wikipedia use this file (pages on other projects are not listed):