
 French
 Deutsch
File:2020 Worldwide CO2 Emissions (by region, per capita), variwide diagram.png

Original file (3,000 × 2,000 pixels, file size: 706 KB, MIME type: image/png)
| This is a file from the Wikimedia Commons. Information from its description page there is shown below. Commons is a freely licensed media file repository. You can help. |
,_variwide_diagram.png)
Summary
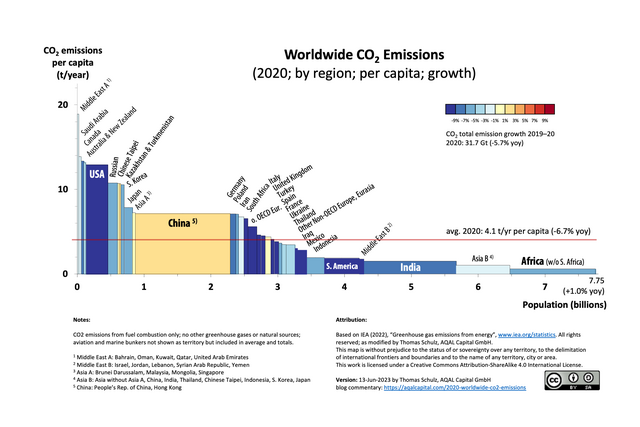
| Description | English: The variwide chart allows the visualization of a multitude of data dimensions in one easy-to-read diagram. These data dimensions are: - Individual country data, such as China, South Africa, or the USA, or a group of countries such as the Middle East, Africa, or Australia/New Zealand, - Population by country or group of countries, - Per capita CO2 emissions, and - CO2 emissions growth year-over-year The total CO2 emissions of a region are represented as a rectangular area. The height of each rectangle is proportional to the CO2 emissions per capita and the width is proportional to the population of the represented region. The regions are sorted by CO2 emissions per capita, from the highest to the lowest. The color of the rectangles indicate their growth rate: “heating up” is represented from light red to dark red, and “cooling down” goes from light blue to dark blue. Based on IEA data from IEA (2022) “Greenhouse gas emissions from energy”, https://www.iea.org/statistics. All rights reserved; as modified by Thomas Schulz, AQAL Capital GmbH. https://aqalcapital.com/2020-worldwide-co2-emissions/ This map is without prejudice to the status of or sovereignty over any territory, to the delimitation of international frontiers and boundaries and to the name of any territory, city or area. License: This work is licensed under a Creative Commons Attribution-ShareAlike 4.0 International License (CC BY-SA 4.0) |
| Date | |
| Source | Own work |
| Author | Tom.schulz |
Licensing
- You are free:
- to share – to copy, distribute and transmit the work
- to remix – to adapt the work
- Under the following conditions:
- attribution – You must give appropriate credit, provide a link to the license, and indicate if changes were made. You may do so in any reasonable manner, but not in any way that suggests the licensor endorses you or your use.
- share alike – If you remix, transform, or build upon the material, you must distribute your contributions under the same or compatible license as the original.
File history
Click on a date/time to view the file as it appeared at that time.
| Date/Time | Thumbnail | Dimensions | User | Comment | |
|---|---|---|---|---|---|
| current | 15:04, 13 June 2023 | | 3,000 × 2,000 (706 KB) | Tom.schulz | added missing data label for S. America |
| 18:40, 21 December 2022 |  | 2,680 × 1,704 (683 KB) | Femke | remove superfluous white space | |
| 11:42, 12 November 2022 |  | 3,000 × 2,000 (700 KB) | Tom.schulz | Uploaded own work with UploadWizard |
File usage
Global file usage
The following other wikis use this file:
- Usage on ha.wikipedia.org
- Usage on id.wikipedia.org
- Usage on sw.wiktionary.org
- Usage on zh.wikipedia.org
,_variwide_diagram.png)