Statistical graphics, also known as statistical graphical techniques, are graphics used in the field of statistics for data visualization. Whereas statistics... 7 KB (650 words) - 12:59, 18 July 2022 |
 | Infographic (redirect from Informational graphics) Similar pursuits are information visualization, data visualization, statistical graphics, information design, or information architecture. Infographics have... 41 KB (4,841 words) - 01:10, 3 January 2024 |
 | their main characteristics, often using statistical graphics and other data visualization methods. A statistical model can be used or not, but primarily... 20 KB (2,189 words) - 06:00, 21 March 2024 |
their days "statistical graphics appear to be reemerging as an important analytic tool, with recent innovations exploiting computer graphics and related... 7 KB (789 words) - 15:38, 10 April 2022 |
generalized statistical software with data mining algorithms and methods for data management ADMB – a software suite for non-linear statistical modeling... 15 KB (1,485 words) - 17:52, 14 March 2024 |
 | Computer graphics deals with generating images and art with the aid of computers. Today, computer graphics is a core technology in digital photography... 69 KB (8,762 words) - 01:48, 22 April 2024 |
Graphics (from Ancient Greek γραφικός (graphikós) 'pertaining to drawing, painting, writing, etc.') are visual images or designs on some surface, such... 21 KB (2,746 words) - 10:14, 25 April 2024 |
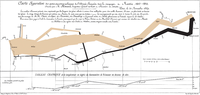
 | Charles Joseph Minard (section Information graphics) diagram is from 1825,: 16 but he did not start regularly producing statistical graphics until the 1840s. During this period he became interested in studying... 17 KB (1,677 words) - 12:25, 17 January 2024 |
 | the statistical programming language R. Created by Hadley Wickham in 2005, ggplot2 is an implementation of Leland Wilkinson's Grammar of Graphics—a general... 11 KB (1,061 words) - 20:48, 1 February 2024 |
 | Data and information visualization (redirect from Data graphics) analysis, such as statistical hypothesis testing. To communicate information clearly and efficiently, data visualization uses statistical graphics, plots, information... 86 KB (7,866 words) - 10:34, 1 April 2024 |