 | A radar chart is a graphical method of displaying multivariate data in the form of a two-dimensional chart of three or more quantitative variables represented... 20 KB (2,515 words) - 13:34, 28 March 2024 |
 | Coxcomb chart, is an enhanced form of pie chart developed by Florence Nightingale. A radar chart or "spider chart" or "doi" is a two-dimensional chart of three... 13 KB (1,513 words) - 22:39, 29 January 2024 |
"Radar Love" is a song by the Dutch rock band Golden Earring. The single version of "Radar Love" reached #9 on the Record World chart, #10 on Cash Box... 13 KB (1,102 words) - 18:09, 26 March 2024 |
and also criticized her vocals for being processed. In July 2008, "Radar" charted in the top 40 of Ireland and New Zealand, and inside the top ten in... 41 KB (3,887 words) - 03:41, 18 April 2024 |
 | A bar chart or bar graph is a chart or graph that presents categorical data with rectangular bars with heights or lengths proportional to the values that... 10 KB (1,282 words) - 16:55, 8 April 2024 |
On the Radar Freestyle" (in Dutch). Single Top 100. Retrieved August 5, 2023. "Drake, Central Cee – On the Radar Freestyle". Swiss Singles Chart. Retrieved... 6 KB (505 words) - 02:42, 15 April 2024 |
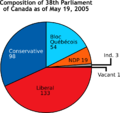
 | pie chart (or a circle chart) is a circular statistical graphic which is divided into slices to illustrate numerical proportion. In a pie chart, the... 21 KB (2,312 words) - 17:31, 26 March 2024 |
 | Scatter plot (redirect from Scatter chart) A scatter plot, also called a scatterplot, scatter graph, scatter chart, scattergram, or scatter diagram, is a type of plot or mathematical diagram using... 9 KB (1,019 words) - 17:14, 8 April 2024 |
 | Marine radars are X band or S band radars on ships, used to detect other ships and land obstacles, to provide bearing and distance for collision avoidance... 5 KB (481 words) - 18:22, 14 February 2024 |
 | Box plot (redirect from Box and whisker chart) introduced by Mary Eleanor Spear in her book "Charting Statistics" in 1952 and again in her book "Practical Charting Techniques" in 1969. The box-and-whisker... 20 KB (2,958 words) - 18:34, 4 April 2024 |