 | A pressure–volume diagram (or PV diagram, or volume–pressure loop) is used to describe corresponding changes in volume and pressure in a system. They are... 10 KB (1,168 words) - 08:01, 28 October 2023 |
| Carnot cycle (section The temperature–entropy diagram) or refrigerator is best understood by using a temperature–entropy diagram (T–S diagram), in which the thermodynamic state is specified by a point on a graph... 25 KB (3,104 words) - 05:42, 2 March 2024 |
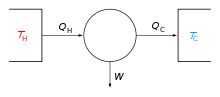
 | Carnot heat engine (section Carnot's diagram) original piston-and-cylinder diagram used by Carnot in discussing his ideal engine. The figure at right shows a block diagram of a generic heat engine, such... 26 KB (3,294 words) - 05:37, 2 March 2024 |
| during a thermodynamic cycle is zero, it forms a closed loop on a PV diagram. A PV diagram's Y axis shows pressure (P) and X axis shows volume (V). The area... 18 KB (2,659 words) - 22:51, 3 December 2023 |
| purpose diagrams include: PV diagram T–s diagram h–s (Mollier) diagram Psychrometric chart Cooling curve Indicator diagram Saturation vapor curve Thermodynamic... 9 KB (1,235 words) - 19:26, 9 April 2024 |
 | Enthalpy–entropy chart (redirect from Mollier diagram) H=U+pV{\displaystyle H=U+pV\,\!} (or, in terms of specific enthalpy, specific entropy and specific volume, h=u+pv{\displaystyle h=u+pv\!} ). The diagram was... 7 KB (802 words) - 05:15, 6 March 2024 |
| Work (thermodynamics) (redirect from PV work) fact that it does not make sense to refer to the work on a point in the PV diagram; work presupposes a path. There are several ways of doing mechanical work... 45 KB (6,937 words) - 23:08, 4 February 2024 |
 | higher order on the pressure. Also at Boyle temperature the dip in a PV diagram tends to a straight line over a period of pressure. We then have... 2 KB (284 words) - 02:09, 30 March 2023 |
 | inflection point in the constant-temperature line (critical isotherm) on a PV diagram. This means that at the critical point: ( ∂ p ∂ V ) T = 0 , {\displaystyle... 21 KB (1,976 words) - 09:35, 29 January 2024 |
thermodynamics, in terms of the values of variables at the critical point. On a PV diagram, the critical point is an inflection point. Thus: (∂P∂V)C=0{\displaystyle... 759 bytes (94 words) - 18:02, 22 July 2022 |