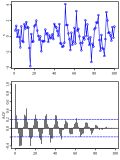
 | In the analysis of data, a correlogram is a chart of correlation statistics. For example, in time series analysis, a plot of the sample autocorrelations... 10 KB (1,389 words) - 14:59, 31 March 2023 |
 | length relative to the reference beam, a correlogram is generated at each pixel. The width of the resulting correlogram is the coherence length, which depends... 16 KB (2,298 words) - 12:06, 1 August 2023 |
 | clustered, and correlogram. Clustered heat map: The example of the monthly temperature by year is a clustered heat map. Correlogram: A correlogram is a clustered... 25 KB (2,958 words) - 09:36, 15 March 2024 |
phase information from the Fourier-space representation of the cross-correlogram. The following image demonstrates the usage of phase correlation to determine... 11 KB (1,664 words) - 11:46, 25 January 2024 |
States Commercial Service County Cricket Ground (disambiguation) Cross-correlogram, a statistical plotting technique Commission of Counter Ghoul, a fictional... 1 KB (204 words) - 09:51, 15 September 2023 |
 | physics in 1999. Li completed her senior thesis, titled "Auditory Binaural Correlogram Difference: A New Computational Model for Huggins Dichotic Pitch," under... 42 KB (3,879 words) - 10:35, 23 April 2024 |
 | Spearman's ρ Scatter plot Graphics Bar chart Biplot Box plot Control chart Correlogram Fan chart Forest plot Histogram Pie chart Q–Q plot Radar chart Run chart... 52 KB (6,216 words) - 20:56, 28 February 2024 |
Spearman's ρ Scatter plot Graphics Bar chart Biplot Box plot Control chart Correlogram Fan chart Forest plot Histogram Pie chart Q–Q plot Radar chart Run chart... 15 KB (2,071 words) - 18:42, 19 April 2024 |
 | 2012). "Scaled correlation analysis: a better way to compute a cross-correlogram". European Journal of Neuroscience. 35 (5): 742–762. doi:10.1111/j.1460-9568... 40 KB (4,833 words) - 20:25, 10 March 2024 |
 | quantum field theory. Autocorrelation Correlation does not imply causation Correlogram Covariance function Pearson product-moment correlation coefficient Correlation... 6 KB (800 words) - 17:31, 20 December 2023 |