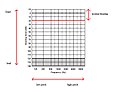
An audiogram is a graph that shows the audible threshold for standardized frequencies as measured by an audiometer. The Y axis represents intensity measured...
15 KB (1,673 words) - 09:31, 3 December 2023
region where the sounds (phonemes) of human languages appear on an audiogram. (An audiogram is a graphical representation of someone's ability to hear over...
3 KB (342 words) - 14:38, 28 March 2024
collective Bran Van 3000, released as the band's debut single in 1997 by Audiogram and Capitol. It was the last song to be recorded for the band's debut...
14 KB (1,210 words) - 23:49, 31 January 2024

contours. Routine investigation for hearing loss usually involves an audiogram which shows threshold levels relative to a normal. Several animal species...
27 KB (3,344 words) - 00:32, 12 May 2024
Audiogram is an independent record label founded in Quebec in 1984. The label represents performers who have contributed to and have marked Quebec's cultural...
5 KB (401 words) - 17:15, 4 February 2023
symptoms they are experiencing. Such a diagnosis is commonly supported by an audiogram, and an otolaryngological and neurological examination. How much tinnitus...
79 KB (8,167 words) - 14:27, 14 May 2024
Presbycusis (section Presbycusis audiogram)
addition there are two other types: Mixed Indeterminate The shape of the audiogram categorizes abrupt high-frequency loss (sensory phenotype) or flat loss...
26 KB (3,310 words) - 22:41, 14 May 2024
Various other descriptors can be used depending on the shape of the audiogram, such as high frequency, low frequency, U-shaped, notched, peaked, or...
72 KB (9,516 words) - 00:51, 22 April 2024

diagnose hearing loss or diseases of the ear, and often make use of an audiogram. The basic requirements of the field were to be able to produce a repeating...
17 KB (2,098 words) - 07:30, 10 May 2024

result of the test is an audiogram diagram which plots a person's hearing sensitivity at the tested frequencies. On an audiogram an "x" plot represents...
13 KB (1,670 words) - 00:04, 22 March 2024