February 2008 California elections
The California state elections, February 2008 were held on February 5, 2008, throughout California . Presidential primaries and a special election for a State Assembly seat were among the contests held. Seven ballot propositions were also decided on.
Presidential primaries [ edit ] Key: Withdrew prior to contest
American Independent presidential primary [ edit ] Three candidates were on the ballot of the American Independent Party , a state political party.
California American Independence presidential primary, 2008[ 1] Candidate Votes Percentage Donald Grundmann 16,603 36.08% Diane Templin 15,302 33.25% Mad Max Riekse 14,099 30.64% David Larson (write-in ) 18 0.04% Totals 46,022 100.00% Voter turnout[A] —
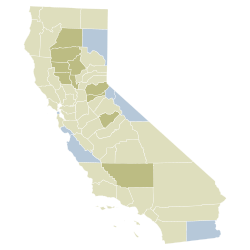
Democratic presidential primary [ edit ] California Democratic presidential primary, 2008[ 1] Candidate Votes Percentage National delegates Hillary Clinton 2,608,184 51.47% 204 Barack Obama 2,186,662 43.16% 166 John Edwards 193,617 3.82% 0 Dennis Kucinich 24,126 0.48% 0 Bill Richardson 19,939 0.39% 0 Joe Biden 18,261 0.36% 0 Mike Gravel 8,184 0.16% 0 Christopher Dodd 8,005 0.16% 0 Willie Carter (write-in ) 4 0.00% 0 Eric Hinzman (write-in) 4 0.00% 0 Phil Epstein (write-in) 3 0.00% 0 Brian Calef (write-in) 2 0.00% 0 David Frey (write-in) 1 0.00% 0 Joseph McAndrew (write-in) 1 0.00% 0 Keith Judd (write-in) 0 0.00% 0 Julius Mogyorossy (write-in) 0 0.00% 0 Totals 5,066,993 100.00% 370 Voter turnout[A] — —
Green presidential primary [ edit ] Seven candidates participated in the Green Party 's presidential primary, which is a non-binding contest.
Libertarian presidential primary [ edit ] California Libertarian presidential primary, 2008[ 1] Candidate Votes Percentage Christine Smith 4,241 25.16% Steve Kubby 2,876 17.06% Wayne Root 2,360 14.00% Bob Jackson 1,486 8.81% Barry Hess 891 5.29% George Phillies 852 5.05% Michael Jingozian 774 4.59% Robert Milnes 721 4.28% Daniel Imperato 707 4.19% John Finan 706 4.19% Dave Hollist 678 4.02% Alden Link 565 3.35% Leon Ray (write-in ) 1 0.01% Totals 16,858 100.00% Voter turnout 20.96%
Peace and Freedom presidential primary [ edit ] Seven candidates participated in the Peace and Freedom presidential primary, a non-binding "beauty contest". Ralph Nader received a plurality of the votes, followed by Gloria La Riva and Cynthia McKinney . Stewart Alexander was nominated to be Socialist Party candidate Brian Moore 's running mate in October 2007, but remained on the Peace and Freedom ballot.
Republican presidential primary [ edit ] California Republican presidential primary, 2008[ 1] Candidate Votes Percentage National delegates John McCain 1,238,988 42.25% 116 Mitt Romney 1,013,471 34.56% 3 Mike Huckabee 340,669 11.62% 0 Rudy Giuliani 128,681 4.39% 0 Ron Paul 125,365 4.27% 0 Fred Thompson 50,275 1.71% 0 Duncan Hunter 14,021 0.48% 0 Alan Keyes 11,742 0.40% 0 John Cox 3,219 0.11% 0 Tom Tancredo 3,884 0.13% 0 Sam Brownback 2,486 0.08% 0 Karen Irish (write-in ) 6 0.00% 0 Michael Shaw (write-in) 2 0.00% 0 Edward Marshall (write-in) 1 0.00% 0 Joel Neuberg (write-in) 1 0.00% 0 Robert Brickell (write-in) 0 0.00% 0 Brian Calef (write-in) 0 0.00% 0 David Frey (write-in) 0 0.00% 0 Walter Rothnie (write-in) 0 0.00% 0 John Sutherland (write-in) 0 0.00% 0 Totals 2,932,811 100.00% 119 Voter turnout 56.08% —
Proposition 91 sought to amend the California Constitution to prohibit motor vehicle fuel sales taxes that are earmarked for transportation purposes from being retained in the state's General Fund.
Proposition 91[ 3] Choice Votes % No 4,794,776 58.31 Yes 3,427,588 41.69
Proposition 92 sought to amend Proposition 98 of 1988, which sets a mandate for the minimum level of funding each year for elementary and secondary schools and community colleges.
Proposition 92[ 3] Choice Votes % No 4,831,445 57.21 Yes 3,613,332 42.79
Proposition 93 sought to change the term limits for members of the California State Legislature in both the State Assembly and State Senate .
Proposition 93[ 3] Choice Votes % No 4,574,826 53.59 Yes 3,961,466 46.41
Proposition 94 sought to expand the Indian Gaming Compact with the Pechanga Band of Luiseño Mission Indians .
Proposition 94[ 3] Choice Votes % Yes 4,812,313 55.56 No 3,848,998 44.44
Proposition 95 sought to expand the Indian Gaming Compact with the Morongo Band of Mission Indians .
Proposition 95[ 3] Choice Votes % Yes 4,809,573 55.60 No 3,841,352 44.40
Proposition 96 sought to expand the Indian Gaming Compact with the Sycuan Band of the Kumeyaay Nation .
Proposition 96[ 3] Choice Votes % Yes 4,785,413 55.45 No 3,844,408 44.54
Proposition 97 sought to expand the Indian Gaming Compact with the Agua Caliente Band of Cahuilla Indians .
Proposition 97[ 3] Choice Votes % Yes 4,786,884 55.50 No 3,838,892 44.50
55th State Assembly district special election [ edit ] The seat of California's 55th State Assembly district was vacated by Assemblymember Laura Richardson , who won a special election to fill California's 37th congressional district on June 26, 2007. The congressional district was vacant after Juanita Millender-McDonald died of cancer on April 22, 2007.
A primary election for the special election was held on December 11, 2007. Since no candidate won a majority, the candidates with the top votes for each party appeared on the ballots for the special election.[ 4]
A [ 6] Decline to State voters to participate.[ 7] [ 6] ^ a b c d e f "The Statement of Vote: President by County" (PDF) . Secretary of State of California . March 15, 2008. Archived from the original (PDF) on April 9, 2008. Retrieved April 13, 2008 .^ "2008 Green Party Presidential Nomination Delegate Count" . Green Party . Archived from the original on June 11, 2008. Retrieved June 9, 2008 .^ a b c d e f g "State Ballot Measures" (PDF) . Secretary of State of California . March 15, 2008. Archived from the original (PDF) on April 17, 2008. Retrieved April 14, 2008 .^ a b "Special Election Results State Assembly, 55th District Special Primary Election, December 11, 2007 FINAL - OFFICIAL CANVASS" (PDF) . Secretary of State of California . December 18, 2007. Archived from the original (PDF) on February 7, 2008. Retrieved February 6, 2008 .^ "State Assembly, 55th District Special General Election, February 5, 2008: Official Canvass" (PDF) . Secretary of State of California . March 15, 2008. Archived from the original (PDF) on April 17, 2008. Retrieved April 14, 2008 .^ a b "Report of Registration as of January 22, 2008" (PDF) . California Secretary of State . March 15, 2008. Archived from the original (PDF) on June 18, 2008. Retrieved June 16, 2008 .^ "Decline to State - Voter Information" . California Secretary of State . Archived from the original on June 18, 2008. Retrieved June 16, 2008 .
February primary election June primary election November general election Presidential United States House of Representatives State Senate State Assembly Propositions : 1A , 2 , 3 , 4 , 5 , 6 , 7 , 8 , 9 , 10 , 11 , and 12 Special elections Local elections


 French
 Deutsch