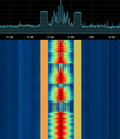
A spectrogram is a visual representation of the spectrum of frequencies of a signal as it varies with time. When applied to an audio signal, spectrograms...
20 KB (2,187 words) - 07:37, 10 May 2024
is used. Spectrogram is one of the most popular time-frequency representation, and generalized spectrogram, also called "two-window spectrogram", is the...
4 KB (803 words) - 16:52, 18 September 2023
Windowlicker (section Spectrogram)
allows the user to insert a digital image as the spectrogram. MetaSynth will then convert the spectrogram to digital sound and "play" the picture. According...
25 KB (2,317 words) - 11:31, 7 June 2024
is moving ice in Antarctica. Sound spectrograms of vibrations caused by friction closely resemble the spectrogram of the Slow Down. This suggests the...
13 KB (1,418 words) - 20:45, 20 May 2024
is a technique for sharpening a time-frequency representation (e.g. spectrogram or the short-time Fourier transform) by mapping the data to time-frequency...
25 KB (4,004 words) - 12:57, 30 April 2024
the spectrogram can be configured. There are three types of spectrogram: generic spectrogram melodic-range spectrogram peak-frequency spectrogram Generic...
6 KB (491 words) - 08:16, 4 February 2024
Acoustic fingerprint (section Spectrogram)
creating a time-frequency graph called a spectrogram. Any piece of audio can be translated into a spectrogram. Each piece of audio is split into segments...
5 KB (612 words) - 16:24, 23 February 2024
A heat map of the computer printout, giving a spectrogram of the beam; the Wow! signal appears as a bright spot in the lower left....
32 KB (3,303 words) - 09:15, 3 June 2024
Spectrogram of a linear chirp. The spectrogram plot demonstrates the linear rate of change in frequency as a function of time, in this case from 0 to 7...
17 KB (2,278 words) - 12:44, 5 April 2024
such as rotational speed. Waterfall plots are also often used to depict spectrograms or cumulative spectral decay[definition needed] (CSD). The results of...
3 KB (173 words) - 15:21, 14 April 2024


