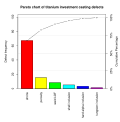
A Pareto chart is a type of chart that contains both bars and a line graph, where individual values are represented in descending order by bars, and the...
4 KB (428 words) - 00:57, 5 June 2024
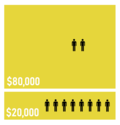
The Pareto principle (also known as the 80/20 rule, the law of the vital few and the principle of factor sparsity) states that for many outcomes, roughly...
24 KB (2,770 words) - 15:08, 9 May 2024
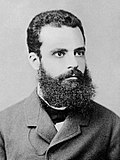
Vilfredo Federico Damaso Pareto (UK: /pæˈreɪtoʊ, -ˈriːt-/ parr-AY-toh, -EE-, US: /pəˈreɪtoʊ/ pə-RAY-toh, Italian: [vilˈfreːdo paˈreːto], Ligurian: [paˈɾeːtu];...
32 KB (3,510 words) - 15:06, 9 May 2024

Cause-and-effect diagram Check sheet Control chart Histogram Pareto chart Scatter diagram Flow chart Run chart The seven basic tools of quality are a fixed...
7 KB (761 words) - 09:25, 31 October 2022
Control chart Greninger chart Heatmap Natal chart Nomogram Pareto chart Run chart Strip chart Structure chart Vowel chart One more example: Bernal chart Box...
13 KB (1,513 words) - 17:59, 31 May 2024
Flowchart (redirect from Flow-chart)
basic tools of quality control, next to the histogram, Pareto chart, check sheet, control chart, cause-and-effect diagram, and the scatter diagram. Similarly...
22 KB (1,738 words) - 09:41, 7 May 2024
chart Run chart Pareto chart Scatter plot (2D/3D) Stem-and-leaf plot Parallel coordinates Odds ratio Targeted projection pursuit Heat map Bar chart Horizon...
19 KB (2,189 words) - 21:13, 7 May 2024

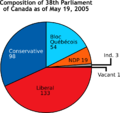
called Pareto charts. Bar graphs can also be used for more complex comparisons of data with grouped (or "clustered") bar charts, and stacked bar charts. In...
10 KB (1,282 words) - 16:55, 8 April 2024
Laboratory quality control (redirect from Levey–Jennings chart)
also include the histogram, pareto chart, check sheet, cause and effect diagram, flowchart and scatter diagram. Control charts prevent unnecessary process...
9 KB (1,168 words) - 22:27, 28 May 2024
Datasaurus dozen (category Statistical charts and diagrams)
Line chart Bar chart Histogram Scatter plot Box plot Pareto chart Pie chart Area chart Tree map Bubble chart Stripe graphic Control chart Run chart Stem-and-leaf...
7 KB (649 words) - 15:39, 25 March 2024